30i/300i/300is-MA, 31i/310i/310is-MA & A5, 32i/320i/320is-MA Maintenance manual Page 161
Maintenance manual
B-63945EN/01 1.DISPLAY AND OPERATION
- 133 -
1.9.1.5 Bode graph
This graph displays a Bode diagram for the measurement data in the
form of a horizontal axis logarithm graph.
Only one draw can be displayed at a time.
Displaying and setting the Bode graph
Procedure
The procedure for displaying the measurement data is described
below.
1 Press the
SYSTEM
function key.
2 Press the continuous menu key
several times until
[SERVO GUIDE MATE] is displayed.
3 Click the [SERVO GUIDE MATE] soft key.
4 Click the [BODE] soft key.
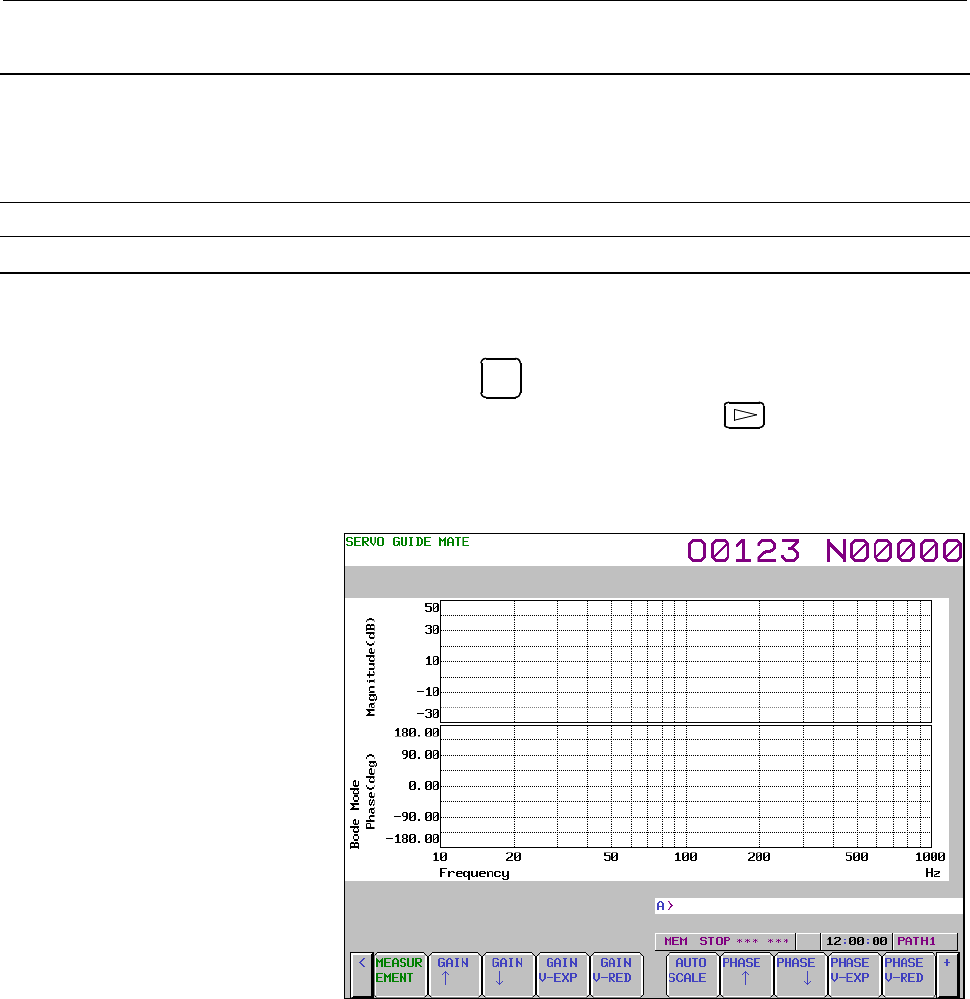
The wave display screen is displayed as shown below.
5 Click the [MEASUREMENT] soft key.
6 Click the [DATA IN] soft key.
Contents Summary of 30i/300i/300is-MA, 31i/310i/310is-MA & A5, 32i/320i/320is-MA Maintenance manual
- Page 1FANUC Series 30*/300*/300*s-MODEL A FANUC Series 31*/310*/310*s-MODEL A5 FANUC Series 31*/310*/310*s-MODEL A FANUC Series 32*/320*/320*s-MODEL A MAINTENANCE MANUAL B-63945EN/02
- Page 2• No part of this manual may be reproduced in any form. • All specifications and designs are subject to change without notice. The export of this product is subject to the authorization of the government of the country from where the product is exported. In this manual we have tried as much as possi
- Page 3B-63945EN/02 SAFETY PRECAUTIONS SAFETY PRECAUTIONS This section describes the safety precautions related to the use of CNC units. It is essential that these precautions be observed by users to ensure the safe operation of machines equipped with a CNC unit (all descriptions in this section assume thi
- Page 4SAFETY PRECAUTIONS B-63945EN/02 1.1 DEFINITION OF WARNING, CAUTION, AND NOTE This manual includes safety precautions for protecting the maintenance personnel (herein referred to as the user) and preventing damage to the machine. Precautions are classified into Warnings and Cautions according to thei
- Page 5B-63945EN/02 SAFETY PRECAUTIONS 1.2 WARNINGS RELATED TO CHECK OPERATION WARNING 1. When checking the operation of the machine with the cover removed (1) The user's clothing could become caught in the spindle or other components, thus presenting a danger of injury. When checking the operation, stand
- Page 6SAFETY PRECAUTIONS B-63945EN/02 5. Ensure that the specified feedrate is appropriate for the intended operation. Generally, for each machine, there is a maximum allowable feedrate. The appropriate feedrate varies with the intended operation. Refer to the manual provided with the machine to determine
- Page 7B-63945EN/02 SAFETY PRECAUTIONS 1.3 WARNINGS RELATED TO REPLACEMENT WARNING 1. Always turn off the power to the CNC and the main power to the power magnetics cabinet. If only the power to the CNC is turned off, power may continue to be supplied to the serve section. In such a case, replacing a unit
- Page 8SAFETY PRECAUTIONS B-63945EN/02 1.4 WARNINGS RELATED TO PARAMETERS WARNING 1. When machining a workpiece for the first time after modifying a parameter, close the machine cover. Never use the automatic operation function immediately after such a modification. Instead, confirm normal machine operatio
- Page 9B-63945EN/02 SAFETY PRECAUTIONS 1.5 WARNINGS AND NOTES RELATED TO DAILY MAINTENANCE WARNING 1. Memory backup battery replacement When replacing the memory backup batteries, keep the power to the machine (CNC) turned on, and apply an emergency stop to the machine. Because this work is performed with
- Page 10SAFETY PRECAUTIONS B-63945EN/02 WARNING 2. Absolute pulse coder battery replacement When replacing the memory backup batteries, keep the power to the machine (CNC) turned on, and apply an emergency stop to the machine. Because this work is performed with the power on and the cabinet open, only those
- Page 11B-63945EN/02 SAFETY PRECAUTIONS WARNING 3. Fuse replacement Before replacing a blown fuse, however, it is necessary to locate and remove the cause of the blown fuse. For this reason, only those personnel who have received approved safety and maintenance training may perform this work. When replacing
- Page 12
- Page 13B-63945EN/02 PREFACE PREFACE The manual consists of the following chapters: Description of this manual 1. DISPLAY AND OPERATION This chapter covers those items, displayed on the screen, that are related to maintenance. A list of all supported operations is also provided at the end of this chapter. 2
- Page 14PREFACE B-63945EN/02 Applicable models This manual can be used with the following models. The abbreviated names may be used. Model name Abbreviation FANUC Series 30i-MODEL A 30i –A Series 30i FANUC Series 300i-MODEL A 300i–A Series 300i FANUC Series 300is-MODEL A 300is–A Series 300is FANUC Series 31
- Page 15B-63945EN/02 PREFACE Related manuals of Series 30i/300i/300is- MODEL A Series 31i/310i/310is- MODEL A Series 31i/310i/310is- MODEL A5 Series 32i/320i/320is- MODEL A The following table lists the manuals related to Series 30i/300i /300is-A, Series 31i/310i /310is-A, Series 31i/310i /310is-A5, Series
- Page 16PREFACE B-63945EN/02 Related manuals of SERVO MOTOR αis/αi/βis/βi series The following table lists the manuals related to SERVO MOTOR αis/αi/βis/βi series Table 2 Related manuals Specification Manual name number FANUC AC SERVO MOTOR αis series FANUC AC SERVO MOTOR αi series B-65262EN DESCRIPTIONS FA
- Page 17B-63945EN/02 TABLE OF CONTENTS TABLE OF CONTENTS SAFETY PRECAUTIONS............................................................................s-1 PREFACE ....................................................................................................p-1 1 DISPLAY AND OPERATION .................
- Page 18TABLE OF CONTENTS B-63945EN/02 1.8.4 Notes ......................................................................................................................80 1.9 SERVO GUIDE MATE................................................................................. 81 1.9.1 Wave Display ............
- Page 19B-63945EN/02 TABLE OF CONTENTS 3.5.2 List of Units..........................................................................................................205 3.5.3 Others ...................................................................................................................206 3.6 REPL
- Page 20TABLE OF CONTENTS B-63945EN/02 4.10.2 Removing the Case Cover ....................................................................................262 4.10.3 Mounting the Case Cover.....................................................................................266 4.10.4 Replacing the Fuse .....
- Page 21B-63945EN/02 TABLE OF CONTENTS 5.5.1 Method of Extraction............................................................................................313 5.5.2 Method of Insertion ..............................................................................................313 5.6 OTHER UNITS .......
- Page 22TABLE OF CONTENTS B-63945EN/02 7.1.2 I/O Signals of PMC ..............................................................................................362 7.1.3 PMC Signal Addresses.........................................................................................363 7.2 MULTI-PMC FUNCTION ....
- Page 23B-63945EN/02 TABLE OF CONTENTS 8 EMBEDDED ETHERNET FUNCTION ................................................ 473 8.1 EMBEDDED ETHERNET PORT AND PCMCIA ETHERNET CARD......... 474 8.2 SETTING UP THE EMBEDDED ETHERNET FUNCTION ........................ 475 8.2.1 Parameter Setting of the FOCAS2/Ethernet
- Page 24TABLE OF CONTENTS B-63945EN/02 10.1.2 Spindle Setting and Tuning Screen ......................................................................546 10.1.2.1 Display method................................................................................................ 546 10.1.2.2 Spindle setting scree
- Page 25B-63945EN/02 TABLE OF CONTENTS 11.20 ALARM SV5134 (FSSB: OPEN READY TIME OUT) ALARM SV5137 (FSSB: CONFIGURATION ERROR) ALARM SV5197 (FSSB: OPEN TIME OUT).............................................. 609 11.21 ALARM SV5136 (FSSB: NUMBER OF AMPS IS SMALL) ........................ 610 11.22 SERVO ALAR
- Page 26TABLE OF CONTENTS B-63945EN/02 C.2 SCREEN CONFIGURATION AND OPERATING PROCEDURE .............. 719 C.2.1 USER DATA LOADING/SYSTEM DATA LOADING Screen.........................720 C.2.2 SYSTEM DATA CHECK Screen........................................................................722 C.2.3 SYSTEM DAT
- Page 27B-63945EN/02 TABLE OF CONTENTS G.3 DATA TYPES TO BE CLEARED............................................................... 768 H PANEL i BIOS SETUP........................................................................ 770 c-11
- Page 28
- Page 29B-63945EN/01 1.DISPLAY AND OPERATION 1 DISPLAY AND OPERATION This chapter describes how to display various screens by the function keys. The screens used for maintenance are respectively displayed. 1.1 FUNCTION KEYS AND SOFT KEYS.......................................2 1.2 SYSTEM COMFIGURATION SCREE
- Page 301.DISPLAY AND OPERATION B-63945EN/01 1.1 FUNCTION KEYS AND SOFT KEYS Operations and soft key display status for each function key are described below: 1.1.1 Soft Key Structure The function keys are used to select the type of screen (function) to be displayed. When a soft key (section select soft key
- Page 31B-63945EN/01 1.DISPLAY AND OPERATION 1.1.2 General Screen Operations - Procedure 1 By pressing a function key on the MDI panel, the chapter selection soft keys that belong to the function are displayed. Example 1) Operation selection key Chapter selection soft Continuous menu keys key 2 When one of
- Page 321.DISPLAY AND OPERATION B-63945EN/01 - Button design change depending on soft key state The soft keys assume one of the following states, depending on the selection target: • Chapter selection soft keys • Operation selection soft keys • Auxiliary menu of operation selection soft keys Depending on th
- Page 33B-63945EN/01 1.DISPLAY AND OPERATION 1.1.3 Function Keys Function keys are provided to select the type of screen to be displayed. The following function keys are provided on the MDI panel: Press this key to display the position screen. POS PROG Press this key to display the program screen. OFFSET Pr
- Page 341.DISPLAY AND OPERATION B-63945EN/01 1.1.4 Soft Keys By pressing a soft key after a function key, the corresponding screen of the function can be displayed. The chapter selection soft keys of each function are described below. The horizontal four keys on the right-hand side are assigned to chapter s
- Page 35B-63945EN/01 1.DISPLAY AND OPERATION Position display screen The chapter selection soft keys that belong to the function key POS and the function of each screen are described below. (1) (2) (3) (4) (5) ABS REL ALL HNDL (OPRT) + Page 1 (6) (7) (8) (9) (10) MONI 5AXMAN (OPRT) + Page 2 Table 1.1.4 (a)
- Page 361.DISPLAY AND OPERATION B-63945EN/01 Program screen The chapter selection soft keys that belong to the function key PROG and the function of each screen are described below. (1) (2) (3) (4) (5) PROGRA FOLDER NEXT CHECK (OPRT) + Page 1 M (6) (7) (8) (9) (10) RSTR JOG (OPRT) + Page 2 Table 1.1.4 (b) P
- Page 37B-63945EN/01 1.DISPLAY AND OPERATION Offset/setting screen The chapter selection soft keys that belong to the function key OFFSET SETTING and the function of each screen are described below. (1) (2) (3) (4) (5) OFFSET SETTING WORK (OPRT) + Page 1 (6) (7) (8) (9) (10) MACRO OPR TOOL (OPRT) + Page 2 M
- Page 381.DISPLAY AND OPERATION B-63945EN/01 Table 1.1.4 (c) Offset No. Chapter menu Description (1) OFFSET Selects the screen for setting tool offset values. (2) SETTING Selects the screen for setting the setting parameters. (3) WORK Selects the screen for setting a workpiece coordinate system offset. (6)
- Page 39B-63945EN/01 1.DISPLAY AND OPERATION System screen The chapter selection soft keys that belong to the function key SYSTEM and the function of each screen are described below. (1) (2) (3) (4) (5) PARAM DGNOS SERVO SYSTEM (OPRT) + Page 1 GUIDEM (6) (7) (8) (9) (10) MEMORY PITCH SERVO SP.SET (OPRT) + P
- Page 401.DISPLAY AND OPERATION B-63945EN/01 (36) (37) (38) (39) (40) REMOTE M CODE (OPRT) + Page 8 DIAG (41) (42) (43) (44) (45) PROFI DEVNET (OPRT) + Page 9 SLAVE MASTER (46) (47) (48) (49) (50) DUAL R.TIME (OPRT) + Page 10 CHECK MACRO Table 1.1.4 (d) System No. Chapter menu Description (1) PARAM Selects
- Page 41B-63945EN/01 1.DISPLAY AND OPERATION No. Chapter menu Description (23) M-INFO Selects the screen for displaying information about maintenance performed. (24) W.DGNS Selects the screen for displaying data such as servo positional deviation values, torque values, machine signals, and so forth as graph
- Page 421.DISPLAY AND OPERATION B-63945EN/01 Message screen The chapter selection soft keys that belong to the function key MESSAGE and the function of each screen are described below. (1) (2) (3) (4) (5) ALARM MSG HISTRY MSGHIS (OPRT) + Page 1 (6) (7) (8) (9) (10) BUILT-IN PCMCIA BOARD (OPRT) + Page 2 LOG
- Page 43B-63945EN/01 1.DISPLAY AND OPERATION Graphic screen The chapter selection soft keys that belong to the function key GRAPH and the function of each screen are described below. (1) (2) (3) (4) (5) PARAM GRAPH (OPRT) + Page 1 Table 1.1.4 (f) Graphic No. Chapter menu Description (1) PARAM Selects the sc
- Page 441.DISPLAY AND OPERATION B-63945EN/01 1.2 SYSTEM COMFIGURATION SCREEN After the system has started normally, you can find the types of installed printed circuit boards and software types by displaying a system configuration screen. 1.2.1 Display Method 1 Press the SYSTEM key. 2 Press the [SYSTEM] sof
- Page 45B-63945EN/01 1.DISPLAY AND OPERATION 1.2.2 Hardware Configuration Screen ・Screen display ・Displayed information The following explains the displayed information: 1. NAME MAIN BOARD - Displays information on the main board, and cards and modules on the main board. OPTION BOARD - Displays information
- Page 461.DISPLAY AND OPERATION B-63945EN/01 1.2.3 Software Configuration Screen - Screen display - Displayed information The following explains the displayed information: SYSTEM : Software type SERIES: Software series EDITION: Software edition - 18 -
- Page 47B-63945EN/01 1.DISPLAY AND OPERATION ・Displayed systems and corresponding software types The following lists the correspondence between displayed systems and software: System Software type CNC(BASIC) CNC basic software CNC(OPT A1) Option assembly A1 CNC(OPT A2) Option assembly A2 CNC(OPT A3) Option
- Page 481.DISPLAY AND OPERATION B-63945EN/01 System Software type GRAPHIC2 15” display control software 2 MACRO EXE1 Macro executor 1 MACRO EXE2 Macro executor 2 MACRO EXE3 Macro executor 3 MACRO EXE4 Macro executor 4 MACRO EXE5 Macro executor 5 MACRO EXE6 Macro executor 6 MACRO EXE7 Macro executor 7 MACRO
- Page 49B-63945EN/01 1.DISPLAY AND OPERATION 1.2.4 Outputting System Configuration Data When you press the [(OPRT)] soft key on the system configuration screen, the [PUNCH] soft key appears. You can output data to an input/output device by pressing the [PUNCH] soft key then [EXEC]. Set the output destinatio
- Page 501.DISPLAY AND OPERATION B-63945EN/01 1.3 DIAGNOSIS FUNCTION 1.3.1 Displaying Diagnosis Screen (1) Press SYSTEM key. (2) Press soft key [DGNOS], then a diagnosis screen is displayed. 1.3.2 Contents Displayed • Causes when the machine does not travel in spite of giving a command 000 WAITING FOR FIN SI
- Page 51B-63945EN/01 1.DISPLAY AND OPERATION • State of TH alarm 030 CHARACTER NUMBER TH ALARM Position of the character that caused TH alarm. The position is counted from the head. 031 TH DATA Data of the character that caused TH alarm. • Details of serial Pulsecoder #7 #6 #5 #4 #3 #2 #1 #0 DGN 200 OVL LV
- Page 521.DISPLAY AND OPERATION B-63945EN/01 STB: Communication failure of serial Pulsecoder. Transferred data is erroneous. PRM: The alarm is detected by the servo, the values specified in the parameter is not correct. #7 #6 #5 #4 #3 #2 #1 #0 DGN 204 OFS MCC LDA PMS OFS: Abnormal current value result of A/
- Page 53B-63945EN/01 1.DISPLAY AND OPERATION AXS: In parameter No. 1023 (servo axis number), a value that falls outside the range of 1 to the number of controlled axes is specified. (For example, 4 is specified instead of 3.) Alternatively, the values specified in the parameter are not consecutive. • Positi
- Page 541.DISPLAY AND OPERATION B-63945EN/01 ALP: The zero point was set by MDI when the α pulse coder had not rotate one or more turns. DTH: An axis detach operation was performed by the controlled-axis detach signal DTCH (G124) or by setting bit 7 (RMV) of parameter No. 0012. #7 #6 #5 #4 #3 #2 #1 #0 DGN 3
- Page 55B-63945EN/01 1.DISPLAY AND OPERATION • Detailed descriptions about invalid servo parameter setting alarms Parameter Detail number Cause Measure number 83 2019 Illegal learning control parameter → See Correct the parameter setting so that each Supplementary. parameter is within a valid range. A value
- Page 561.DISPLAY AND OPERATION B-63945EN/01 Parameter Detail number Cause Measure number If the value specified as the number of velocity Decrease the value for the parameter listed at the 1284 2128 pulses is small, the internal value of the current left to within a range where no alarm will occur 1285 con
- Page 57B-63945EN/01 1.DISPLAY AND OPERATION DGN 355 Communication alarm ignore counter (separate type) DGN 356 Link processing counter (built-in type) DGN 357 Link processing counter (separate type) The number of times a communication error occurred during serial communication with the detector is indicate
- Page 581.DISPLAY AND OPERATION B-63945EN/01 DGN 360 Cumulative value of specified pulses (NC) [Data type] 2-word [Unit of data] Detection unit [Valid data range] -99999999 to 99999999 Cumulative value of move commands distributed from the CNC since power-on is indicated. DGN 361 Compensation pulses (NC) [D
- Page 59B-63945EN/01 1.DISPLAY AND OPERATION • Diagnosis data related to the serial spindles DGN 403 Motor temperature of first spindle [Data type] Byte spindle [Unit of data] °C [Valid data range] 0 to 255 The temperature of the winding of the spindle motor is indicated. This information can be used to det
- Page 601.DISPLAY AND OPERATION B-63945EN/01 DGN 425 Spindle synchronization error [Data type] 2-word spindle [Unit of data] Detection unit When the spindles are in synchronization mode, the absolute value of the synchronization error when each spindle is set as the slave axis is indicated. DGN 445 Spindle
- Page 61B-63945EN/01 1.DISPLAY AND OPERATION DGN 457 Width of synchronization error during rigid tapping (maximum value) [Data type] 2-word spindle [Unit of data] Detection unit DGN 458 Tapping axis distribution amount during rigid tapping (cumulative value) [Data type] 2-word spindle [Unit of data] Detecti
- Page 621.DISPLAY AND OPERATION B-63945EN/01 • Diagnosis data related to the dual position feedback function DGN 550 Closed loop error [Data type] 2-word axis [Unit of data] Detection unit [Valid data range] -99999999 to +99999999 DGN 551 Semi-closed loop error [Data type] 2-word axis [Unit of data] Detecti
- Page 63B-63945EN/01 1.DISPLAY AND OPERATION • State of high-speed HRV current control #7 #6 #5 #4 #3 #2 #1 #0 DGN 700 HOK HON [Data type] Bit axis The state of high-speed HRV current control is displayed. HON: The motor is controlled in the high-speed HRV current control mode. HOK: This bit is set to 1 whe
- Page 641.DISPLAY AND OPERATION B-63945EN/01 • Diagnosis data related to axis synchronous control DGN 3500 Synchronization error amount [Data type] 2-word axis [Unit of data] Detection unit [Valid data range] −99999999 to +99999999 The difference in position (synchronization error amount) between the master
- Page 65B-63945EN/01 1.DISPLAY AND OPERATION DGN 3549 Linear scale with absolute address reference marks Status display DGN 3550 Linear scale with absolute address reference marks Scale value [Data type] 2-word axis [Unit of data] Detection unit [Valid data range] -999999999 to 999999999 - 37 -
- Page 661.DISPLAY AND OPERATION B-63945EN/01 1.4 CNC STATE DISPLAY - Description of each display (9) DATA IS OUT OF RANGE (1) (2) (3) (4) (6) (7) (8) (5) : (10) : (5) is displayed in the (10) is displayed at the area for (3) and (4). position where (8) is now displayed. Fig. 1.3.2 (a) (1) Current mode MDI :
- Page 67B-63945EN/01 1.DISPLAY AND OPERATION (3) Axis moving status/dwell status MTN : Indicates that the axis is moving. DWL : Indicates the dwell state. *** : Indicates a state other than the above. (4) State in which an auxiliary function is being executed FIN : Indicates the state in which an auxiliary
- Page 681.DISPLAY AND OPERATION B-63945EN/01 MEM-CHK : Indicates that a program memory check is being made. WSFT : Indicates that the workpiece shift amount write mode is set. LEN : Indicates that the active offset value change mode (tool length offset value of the M series) is set. RAD : Indicates that the
- Page 69B-63945EN/01 1.DISPLAY AND OPERATION (9) Warning for data setting or input/output operation When invalid data is entered (wrong format, value out of range, etc.), when input is disabled (wrong mode, write disabled, etc.), or when input/output operation is incorrect (wrong mode, etc.), a warning mess
- Page 701.DISPLAY AND OPERATION B-63945EN/01 1.5 OPERATING MONITOR Load meter of the servo axis and the serial spindle and the speed meter can be displayed. 1.5.1 Display Method 1 Set a parameter to display operating monitor. (Bit 5 (OPM) of parameter No.3111) 2 Press the POS key to display the position dis
- Page 71B-63945EN/01 1.DISPLAY AND OPERATION 1.5.2 Parameters #7 #6 #5 #4 #3 #2 #1 #0 3111 OPS OPM [Data type] Bit OPM Operating monitor display is: 0: Disabled 1: Enabled OPS The speedometer on the operating monitor screen displays: 0: Spindle motor speed 1: Spindle speed - 43 -
- Page 721.DISPLAY AND OPERATION B-63945EN/01 1.6 WAVEFORM DIAGNOSIS DISPLAY The waveform diagnosis display function traces values of data such as servo positional deviation amount, torque, and machine signals and plots and displays a graph representing changes in the traced data. This function facilitates s
- Page 73B-63945EN/01 1.DISPLAY AND OPERATION 1.6.1 Waveform Diagnosis Graph Screen 1 Press the MDI key SYSTEM . 2 Pressing the [W.DGNS] soft key displays a screen as shown below. 3 Pressing the [(OPRT)] operation soft key displays the following soft keys: - Servo and spindle data Each waveform is drawn in a
- Page 741.DISPLAY AND OPERATION B-63945EN/01 1.6.2 Waveform Diagnosis Parameter Screen Display 1 Press the MDI key SYSTEM . 2 Press the soft key [W.DGNS]. 3 Pressing the soft key [PARAME] displays the waveform diagnosis parameter screen. - 46 -
- Page 75B-63945EN/01 1.DISPLAY AND OPERATION Editing 1 Follow the steps explained in "Display" to display the screen. 2 Pressing the cursor keys moves the cursor on the screen. 3 Press numeric keys, then press the INPUT MDI key or [INPUT] soft key to set the entered value. 4 Press the [(OPRT)] operation sof
- Page 761.DISPLAY AND OPERATION B-63945EN/01 Trace setting - Trace condition One of the following three trace conditions can be selected to start and end tracing: Type 1 (1: JUST) Data is traced only for a specified period of time immediately after the [TRACE] soft key is pressed. Trace time Time [TRACE] pr
- Page 77B-63945EN/01 1.DISPLAY AND OPERATION Setting Trace condition 1 Type 1 2 Type 2 3 Type 3 - Sampling cycle Set the sampling cycle period for waveforms and the sampling cycle for signals as follows: Type Setting Waveform Multiple of 2 ranging from 2 ms to 4096 ms Signal Multiple of 2 ranging from 2 ms
- Page 781.DISPLAY AND OPERATION B-63945EN/01 - Graduation unit on the horizontal axis Set an increment per graduation on the horizontal axis. Valid data range : 1 to 100000000 Unit of data : ms Trigger setting - Trigger type If you specify the occurrence of an event as a trigger when selecting a trace condi
- Page 79B-63945EN/01 1.DISPLAY AND OPERATION Setting Alarm type 1 PW alarms 2 IO alarms 3 PS alarms 4 OT alarms 5 OH alarms 6 SV alarms 7 SR alarms 8 MC alarms 9 SP alarms 10 DS alarms 11 IE alarms 12 BG alarms 13 SN alarms 14 EX alarms 15 PC alarms - Alarm No. If 6 (SV alarms) or 9 (SP alarms) is specified
- Page 801.DISPLAY AND OPERATION B-63945EN/01 Waveform setting - Trace data type Set the type number of data to be traced as listed below: Setting Type unit 0 (Not traced) 1 Servo positional deviation Pulse (detection unit) 2 Servo pulses after distribution Pulse (detection unit) 3 Servo torque % 4 Servo pul
- Page 81B-63945EN/01 1.DISPLAY AND OPERATION NOTE The servo torque and current command value are represented by percentages to parameter No. 2086 (rated current). - Axis number/path number Specify an axis number or path number according to the type of data to be traced as follows: Type Setting Servo positio
- Page 821.DISPLAY AND OPERATION B-63945EN/01 Signal setting - Signal setting When the ON/OFF state of an input/output signal is to be traced, set the address of the signal. With a multi-path PMC, an address on a PMC path is set by specifying the path number together with the address. Example: 2:F0001.1 As s
- Page 83B-63945EN/01 1.DISPLAY AND OPERATION NOTE 1 For PMC path numbers, refer to "Multi-Path PMC Function" in "FANUC Series 30i-MODEL-A PMC Programming Manual" (B-63983EN). 2 If the keyboard used does not have the ":" key, use ";" or "/" instead of ":". 3 For signal data, even when just one signal address
- Page 841.DISPLAY AND OPERATION B-63945EN/01 2 Pressing the [EXPLAIN] soft key displays a list of trace data types. - Waveform color 1 When the [(OPRT)] soft key is pressed with the cursor positioned at the waveform color in the trace waveform setting, the [EXPLAIN] soft key appears. 2 Pressing the [EXPLAIN
- Page 85B-63945EN/01 1.DISPLAY AND OPERATION 1.6.3 Tracing Data Starting tracing 1 Display the waveform diagnosis graph screen. 2 Press the [TRACE] soft key to start tracing. "Now Sampling…" appears in the upper part of the screen. When tracing ends, the indication "Now Sampling…" disappears. Even when the
- Page 861.DISPLAY AND OPERATION B-63945EN/01 When [WAVE.EX] or [WAVE.RE] is pressed, the length of the time axis on one screen is extended or reduced, respectively. The graduation unit on the horizontal axis, which is a parameter, also changes automatically. The graduation unit changes from 1 to 2 to 5 to 1
- Page 87B-63945EN/01 1.DISPLAY AND OPERATION 1.6.4 Outputting Data Waveform diagnosis data can be output to an input/output device. Specifying a format When outputting data, you can select one of the two formats, which are the FS16i compatible format (called the 16 compatible format hereinafter) and the FS3
- Page 881.DISPLAY AND OPERATION B-63945EN/01 (2) Date and time of start/end of tracing - Starting date and time T 6 9 D * * * * * * * * , * * * * * * ; Year Month Day Hour Min Sec - Ending date and time T 9 2 D * * * * * * * * , * * * * * * ; Year Month Day Hour Min Sec NOTE The ending date and time is outp
- Page 89B-63945EN/01 1.DISPLAY AND OPERATION (5) Selection items T 6 8 P * * D * * , * * , ~ * * ; Measurement item Axis No./path No./signal address P0 Servo positional deviation Controlled axis number P1 Servo pulses after distribution (1 to 32) P2 Servo torque P3 Actual servo speed P4 Servo current comman
- Page 901.DISPLAY AND OPERATION B-63945EN/01 (6) Waveform diagnosis data T 6 0 D * * , * * , ~ * * ; T 6 1 D * * , * * , ~ * * ; T 6 2 D * * , * * , ~ * * ; T 6 3 D * * , * * , ~ * * ; T 6 4 D * * , * * , ~ * * ; T 6 5 D * * , * * , ~ * * ; T 7 0 D * * , * * , ~ * * ; T 7 5 D * * , * * , ~ * * ; T 8 0 D * *
- Page 91B-63945EN/01 1.DISPLAY AND OPERATION ・Sample file T01WAVE DIAGNOSE Header T69D20040101,120125 Start time T92D20040101,120130 End time T90D2 Waveform period T91D4 Signal period T68P0D1,2 Measurement item/axis T68P4D1 T68P10D1 T68P30DG0010.4,G0010.5,G0010.6 Measurement item/signal T60D643,6420 Wavefor
- Page 921.DISPLAY AND OPERATION B-63945EN/01 Outputting a file 1 Display the waveform diagnosis graph screen. 2 When the [(OPRT)] operation soft key is pressed, soft keys are displayed in the following operation selection state: 3 Change the mode to the EDIT mode. 4 Enter a file name in the key-in buffer, a
- Page 93B-63945EN/01 1.DISPLAY AND OPERATION 1.7 COLOR SETTING SCREEN On the color setting screen, the colors of the VGA screen can be set. 1.7.1 Screen Display 1 Press the function key SYSTEM . 2 Press the continuous menu key several times until the [COLOR] soft key is displayed. 3 Pressing the [COLOR] sof
- Page 941.DISPLAY AND OPERATION B-63945EN/01 1.7.2 Operations for Color Setting • Modification to color settings (color palette values) 1 Pressing the [(OPRT)] soft key displays the following operation soft keys: RED GREEN BLUE BRIGHT DARK + 2 Move the cursor to a color number whose color palette values are
- Page 95B-63945EN/01 1.DISPLAY AND OPERATION • Calling color settings (color palette values) MEMORY RECALL COLOR1 COLOR2 COLOR3 + 1 Select an area for storing color palette values by pressing the [COLOR1], [COLOR2], or [COLOR3] operation soft key. (The [COLOR1], [COLOR2], and [COLOR3] soft keys, when not di
- Page 961.DISPLAY AND OPERATION B-63945EN/01 [Valid data range] 00 to 15 for each color data (same as the tone level on the color setting screen) When a value equal to or greater than 16 is specified, the specification of 15 is assumed. (Example) When setting the color tone level as red = 1, green = 2, and
- Page 97B-63945EN/01 1.DISPLAY AND OPERATION 1.8 POWER MATE CNC MANAGER FUNCTION When the I/O Link Option for the FANUC servo unit β series (called I/O Link β below) is used for CNC additional axes (slaves), the Power Mate CNC manager function can be used to display and set up various types of data of these
- Page 981.DISPLAY AND OPERATION B-63945EN/01 1.8.1 Screen Display 1 Press the function key SYSTEM . 2 Press the continuous menu key several times until the soft key is displayed. P.MATE MGR. 3 Pressing the [P.MATE MGR.] soft key displays the absolute coordinate screen, which is the initial screen of the Pow
- Page 99B-63945EN/01 1.DISPLAY AND OPERATION Current position display screen The current position display screen displays the current position and actual feedrate of the slave. The following current position data is displayed: Absolute coordinate (current position in the absolute coordinate system) Machine
- Page 1001.DISPLAY AND OPERATION B-63945EN/01 Parameter screen The parameters required for the functions of the slave must be specified in advance. Press the [PARAM] soft key. The following parameter screen appears: This screen displays only the bit and decimal data. For details of the parameters, refer to F
- Page 101B-63945EN/01 1.DISPLAY AND OPERATION • Setting a parameter You can directly set an I/O Link β parameter of the slave from the CNC. 1 Select a desired parameter using either of the above methods. 2 Press the [(OPRT)] soft key. The following soft keys appear: 3 Enter setting data. 4 Press the [INPUT]
- Page 1021.DISPLAY AND OPERATION B-63945EN/01 Diagnosis screen The diagnosis screen displays diagnosis information of the slave. Diagnosis data is displayed in bit or integer (decimal) representation. For details of diagnosis data, refer to FANUC SERVO MOTOR β series I/O Link Option Maintenance Manual. - Dis
- Page 103B-63945EN/01 1.DISPLAY AND OPERATION System configuration screen The system configuration screen displays the system software information of the slave. - Display method 1 Press the continuous menu key . 2 Press the [SYSTEM] soft key to select the system configuration screen. Series and edition of th
- Page 1041.DISPLAY AND OPERATION B-63945EN/01 1.8.2 Inputting and Outputting Parameters Outputting parameters Parameters are output to the CNC memory or a memory card as a data file in the program format. Set the first registration program number in parameter No. 8760. For each slave, program with a predeter
- Page 105B-63945EN/01 1.DISPLAY AND OPERATION NOTE 1 Parameters can be saved in other than the MEM mode or in the emergency stop status. 2 To save parameters in a memory card, if a file with the same name is found in the memory card, the parameters cannot be saved. Delete the file from the memory card or cha
- Page 1061.DISPLAY AND OPERATION B-63945EN/01 1.8.3 Parameters #7 #6 #5 #4 #3 #2 #1 #0 0960 PPE PMN MD2 MD1 [Input type] Setting input [Data type] Bit path #1 MD1 #2 MD2 The slave parameters are input from and output to either of the following devices: Parameter MD2 Parameter MD1 I/O destination 0 0 Program
- Page 107B-63945EN/01 1.DISPLAY AND OPERATION (Set a value with which any used program number does not exceed 99999999.) Warning If an alarm is issued for the Power Mate CNC manager, a warning message is displayed. Message Description DATA ERROR An attempt was made to execute [PUNCH] (NC → β) for a program n
- Page 1081.DISPLAY AND OPERATION B-63945EN/01 1.8.4 Notes - Connecting an I/O Link When I/O Link β is used as a slave of an I/O Link, the CNC assigns I/O addresses. The slave data is input and output in 16-byte units. Therefore, be sure to specify 128 as the number of input/output points. Up to eight slaves
- Page 109B-63945EN/01 1.DISPLAY AND OPERATION 1.9 SERVO GUIDE MATE The servo guide mate enables various types of data related to the servo motor and spindle motor to be displayed on the screen in the form of graphs. This allows you to readily measure the machine precision, thereby making it easy to grasp cha
- Page 1101.DISPLAY AND OPERATION B-63945EN/01 1.9.1 Wave Display The wave display function can acquire various types of data related to the servo motor and spindle motor and display graphs in several different drawing modes for the analysis of the measurement data. A graph is made up of the two elements desc
- Page 111B-63945EN/01 1.DISPLAY AND OPERATION 1.9.1.1 Y-time graph The Y-time graph displays wave data for the measurement data along the time axis, as by an oscilloscope. Up to four draws can be displayed at a time. Displaying and setting the Y-time graph Procedure The procedure for displaying the measureme
- Page 1121.DISPLAY AND OPERATION B-63945EN/01 7 Click the [SAMPLING] soft key. The data-in screen is displayed as shown below. 8 Move the cursor to the parameter you want to set, by pressing the cursor key. 9 Enter data and then press the INPUT key. 10 Repeat steps 8 and 9 until you set all the parameters. 1
- Page 113B-63945EN/01 1.DISPLAY AND OPERATION 14 Repeat steps 12 and 13 until you set all the parameters. 15 Click the [RE-DSPGRAPH] soft key. 16 Click the [OPERATION & GRAPH] soft key. The operation and graph setting screen is displayed as shown below. To set any draw other than the one currently displayed,
- Page 1141.DISPLAY AND OPERATION B-63945EN/01 21 Click the [SCALE SET] soft key. The scale setting screen is displayed as shown below. 22 Move the cursor to the parameter you want to set, by pressing the cursor key. 23 Enter data and the press the INPUT key. 24 Repeat steps 22 and 23 until you set all the pa
- Page 115B-63945EN/01 1.DISPLAY AND OPERATION - Changing the operation and graph setting screen The procedure for changing the operation and graph setting screen as necessary is described below. 1 Click the [OPERATION & GRAPH] soft key. The operation and graph setting screen is displayed as shown below. To s
- Page 1161.DISPLAY AND OPERATION B-63945EN/01 5 Click the [RE-DSPGRAPH] soft key. Based on the new operation and graph settings, the wave display screen is displayed as shown below. - Changing the scale screen The procedure for changing the scale settings as necessary is described below. 1 Click the [SCALE S
- Page 117B-63945EN/01 1.DISPLAY AND OPERATION - Manipulating the Y-time graph By clicking the following soft keys, you can perform the operations corresponding to them. [MEASUREMENT] : Performs a measurement-related operation. [←] : Shifts the time axis to the right. [→] : Shifts the time axis to the left. [
- Page 1181.DISPLAY AND OPERATION B-63945EN/01 [SCALE SET] : Sets scales. [COM1 INPUT] : Inputs comment 1. [COM2 INPUT] : Inputs comment 2. [XY] : Switches to the XY graph. [CIRCLE] : Switches to the Circle graph. [FOURIER] : Switches to the Fourier graph. [BODE] : Switches to the Bode graph. - Performing mea
- Page 119B-63945EN/01 1.DISPLAY AND OPERATION 4 Click the [SAMPLING] soft key. The data-in screen is displayed as shown below. 5 Move the cursor to the parameter you want to set, by pressing the cursor key. 6 Enter data and the press the INPUT key. 7 Repeat steps 5 and 6 until you set all the parameters. 8 C
- Page 1201.DISPLAY AND OPERATION B-63945EN/01 11 Repeat steps 9 and 10 until you set all the parameters. 12 Click the [RE-DSPGRAPH] soft key. The wave display screen is displayed as shown below. 13 The new settings will take effect next time you perform measurement. Change the operation/graph settings and sc
- Page 121B-63945EN/01 1.DISPLAY AND OPERATION Table 1.9.1.1 (g) Sampling cycles Input Meaning (sampling Servo axis Spindle axis value cycle) 1 100ms Specifiable Specifiable 2 50ms Specifiable Specifiable 3 20ms Specifiable Specifiable 4 10ms Specifiable Specifiable 5 5ms Specifiable Specifiable 6 2ms Specifi
- Page 1221.DISPLAY AND OPERATION B-63945EN/01 - Setting the channel setting screen Up to four sets of measurement data can be specified per channel. Be sure to set measurement data starting with the smallest channel number. • Axis Specify an axis number for the data to be specified. Use a positive control ax
- Page 123B-63945EN/01 1.DISPLAY AND OPERATION Table 1.9.1.1 (i) Spindle motor measurement data types Input Item name Description value 1 SPEED Motor speed 2 INORM Motor current amplitude 3 TCMD Torque command 4 VCMD Velocity command 5 VERR Velocity error 7 PERR1 Position error 8 ORERR Orientation position er
- Page 1241.DISPLAY AND OPERATION B-63945EN/01 Table 1.9.1.1 (k) Corresponding measurement data units Servo motor data Corresponding Spindle motor Corresponding type unit data type unit 4 : mm 6 : µm 5 : POSF 1 : SPEED 20 : 1/min 8 : inch 9 : deg 20 : 1/min 36 : -- 1 : VCMD 2 : INORM 14 : m/min 31 : A(p) 31 :
- Page 125B-63945EN/01 1.DISPLAY AND OPERATION • Origin value Specify the value that is to be set as the initial value for each channel when you click the [MEASUREMENT] soft key and then the [ORIGIN] soft key. • Extended address Under normal circumstances, this item is unspecifiable and not used. (This is a r
- Page 1261.DISPLAY AND OPERATION B-63945EN/01 Table 1.9.1.1 (l) Y-time graph operations Input Operation Description value name Feed smoothness display Only those channels whose positions have been measured can be selected. This item displays the 7 Smooth deviation from the ideal position calculated on the as
- Page 127B-63945EN/01 1.DISPLAY AND OPERATION Table 1.9.1.1 (m) Y-time graph conditions Coordinate Operation Input 1 Input 2 Remarks conversion Channel whose Channel whose 1 : Normal position has position has been measured been measured Channel whose Channel whose position has position has been measured been
- Page 1281.DISPLAY AND OPERATION B-63945EN/01 • Display unit Specifiable values are as shown in Table 12.5.1.1(h), Display units. The conditions for specifying these display units are as shown in Table 12.5.1.1(i), Y-time graph display units. Table 1.9.1.1 (n) Display units Input value Unit Input value Unit
- Page 129B-63945EN/01 1.DISPLAY AND OPERATION Table 1.9.1.1 (o) Corresponding Y-time graph display units Input 1 measurement Operation Specifiable display unit data unit 11 : mm/sec 4 : mm 12 : mm/min 5:m 13 : m/sec 6 : µm 14 : m/min 7 : nm 15 : inch/sec 3 : Diff1 ( VT ) 8 : inch 16 : inch/min 17 : deg/sec 1
- Page 1301.DISPLAY AND OPERATION B-63945EN/01 • Coordinate conversion Specifiable values are 1 (Normal; no coordinate conversion), 2 (Polar; coordinate conversion for polar coordinate interpolation), and 3 (Angular; coordinate conversion for angular axis control). The conditions for the specifiable coordinat
- Page 131B-63945EN/01 1.DISPLAY AND OPERATION Limitation - Data update cycle Position-related data is updated at intervals of 1 ms, and power-related data is updated at the current cycle. Therefore, even if you specify a sampling cycle that is shorter than the data update cycle, the displayed data remains un
- Page 1321.DISPLAY AND OPERATION B-63945EN/01 1.9.1.2 XY graph This graph provides a 2-dimensional path display of measurement data by using 2-axis data. Up to two draws can be displayed at a time. Displaying and setting the XY graph Procedure The procedure for displaying the measurement data is described be
- Page 133B-63945EN/01 1.DISPLAY AND OPERATION 7 Click the [SAMPLING] soft key. The data-in screen is displayed as shown below. 8 Move the cursor to the parameter you want to set, by pressing the cursor key. 9 Enter data and the press the INPUT key. 10 Repeat steps 8 and 9 until you set all the parameters. 11
- Page 1341.DISPLAY AND OPERATION B-63945EN/01 14 Repeat steps 12 and 13 until you set all the parameters. 15 Click the [RE-DSPGRAPH] soft key. 16 Click the [OPERATION & GRAPH] soft key. The operation and graph setting screen is displayed as shown below. To set any draw other than the one currently displayed,
- Page 135B-63945EN/01 1.DISPLAY AND OPERATION 21 Click the [SCALE SET] soft key. The scale setting screen is displayed as shown below. 22 Move the cursor to the parameter you want to set, by pressing the cursor key. 23 Enter data and the press the INPUT key. 24 Repeat steps 22 and 23 until you set all the pa
- Page 1361.DISPLAY AND OPERATION B-63945EN/01 - Changing the operation and graph setting screen The procedure for changing the operation and graph setting screen as necessary is described below. 1 Click the [OPERATION & GRAPH] soft key. The operation and graph setting screen is displayed as shown below. To s
- Page 137B-63945EN/01 1.DISPLAY AND OPERATION 5 Click the [RE-DSPGRAPH] soft key. Based on the new operation and graph settings, the wave display screen is displayed as shown below. - Changing the scale screen The procedure for changing the scale settings as necessary is described below. 1 Click the [SCALE S
- Page 1381.DISPLAY AND OPERATION B-63945EN/01 5 Click the [RE-DSPGRAPH] soft key. Based on the new scale settings, the wave display screen is displayed as shown below. - Manipulating the XY graph By clicking the following soft keys, you can perform the operations corresponding to them. [MEASUREMENT] : Perfor
- Page 139B-63945EN/01 1.DISPLAY AND OPERATION - Performing measurement When you click the [MEASUREMENT] soft key, you can perform the operations corresponding to the menu items that follow. [START] : Starts measurement. [ORIGIN] : Sets the origin value. [STOP] : Stops measurement. [DATA IN] : Specifies measu
- Page 1401.DISPLAY AND OPERATION B-63945EN/01 4 Click the [SAMPLING] soft key. The data-in screen is displayed as shown below. 5 Move the cursor to the parameter you want to set, by pressing the cursor key. 6 Enter data and the press the INPUT key. 7 Repeat steps 5 and 6 until you set all the parameters. 8 C
- Page 141B-63945EN/01 1.DISPLAY AND OPERATION 11 Repeat steps 9 and 10 until you set all the parameters. 12 Click the [RE-DSPGRAPH] soft key. The wave display screen is displayed as shown below. 13 The new settings will take effect next time you perform measurement. Change the operation/graph settings and sc
- Page 1421.DISPLAY AND OPERATION B-63945EN/01 - Setting the operation and graph setting screen In the operation and graph setting screen, up to two graphs can be set per draw. • Operation The specifiable values are as shown in Table 12.5.1.2(a), XY graph operations. An operation cannot be specified if it doe
- Page 143B-63945EN/01 1.DISPLAY AND OPERATION • Coordinate conversion Specifiable values are 1 (Normal; no coordinate conversion), 2 (Polar; coordinate conversion for polar coordinate interpolation), and 3 (Angular; coordinate conversion for angular axis control). The conditions for the specifiable coordinat
- Page 1441.DISPLAY AND OPERATION B-63945EN/01 1.9.1.3 Circle graph This graph displays an enlarged view of the path deviation from the specified circle arising during circular cutting. Only one draw can be displayed. Displaying and setting the circle graph Procedure The procedure for displaying the measureme
- Page 145B-63945EN/01 1.DISPLAY AND OPERATION 7 Click the [SAMPLING] soft key. The data-in screen is displayed as shown below. 8 Move the cursor to the parameter you want to set, by pressing the cursor key. 9 Enter data and the press the INPUT key. 10 Repeat steps 8 and 9 until you set all the parameters. 11
- Page 1461.DISPLAY AND OPERATION B-63945EN/01 14 Repeat steps 12 and 13 until you set all the parameters. 15 Click the [RE-DSPGRAPH] soft key. 16 Click the [OPERATION & GRAPH] soft key. The operation and graph setting screen is displayed as shown below. 17 Move the cursor to the parameter you want to set, by
- Page 147B-63945EN/01 1.DISPLAY AND OPERATION 23 Enter data and the press the INPUT key. 24 Repeat steps 22 and 23 until you set all the parameters. 25 Click the [RE-DSPGRAPH] soft key. 26 Click the [MEASUREMENT] soft key. 27 Click the [START] soft key. 28 Start the automatic or manual operation. 29 When the
- Page 1481.DISPLAY AND OPERATION B-63945EN/01 2 Move the cursor to the parameter you want to set, by pressing the cursor key. 3 Enter data and the press the INPUT key. 4 Repeat steps 2 and 3 until you set all the parameters. 5 Click the [RE-DSPGRAPH] soft key. Based on the new operation and graph settings, t
- Page 149B-63945EN/01 1.DISPLAY AND OPERATION 3 Enter data and the press the INPUT key. 4 Repeat steps 2 and 3 until you set all the parameters. 5 Click the [RE-DSPGRAPH] soft key. Based on the new scale settings, the wave display screen is displayed as shown below. - Manipulating the Circle graph By clickin
- Page 1501.DISPLAY AND OPERATION B-63945EN/01 [BODE] : Switches to the Bode graph. - Performing measurement When you click the [MEASUREMENT] soft key, you can perform the operations corresponding to the menu items that follow. [START] : Starts measurement. [ORIGIN] : Sets the origin value. [STOP] : Stops mea
- Page 151B-63945EN/01 1.DISPLAY AND OPERATION 4 Click the [SAMPLING] soft key. The data-in screen is displayed as shown below. 5 Move the cursor to the parameter you want to set, by pressing the cursor key. 6 Enter data and the press the INPUT key. 7 Repeat steps 5 and 6 until you set all the parameters. 8 C
- Page 1521.DISPLAY AND OPERATION B-63945EN/01 11 Repeat steps 9 and 10 until you set all the parameters. 12 Click the [RE-DSPGRAPH] soft key. The wave display screen is displayed as shown below. 13 The new settings will take effect next time you perform measurement. Change the operation/graph settings and sc
- Page 153B-63945EN/01 1.DISPLAY AND OPERATION - Setting the operation and graph setting screen The operation and graph setting screen lets you specify graph settings. • Operation The specifiable values are as shown in Table 12.5.1.3(a), Circle graph operations. An operation cannot be specified if it does not
- Page 1541.DISPLAY AND OPERATION B-63945EN/01 • Coordinate conversion Specifiable values are 1 (Normal; no coordinate conversion), 2 (Polar; coordinate conversion for polar coordinate interpolation), and 3 (Angular; coordinate conversion for angular axis control). The conditions for the specifiable coordinat
- Page 155B-63945EN/01 1.DISPLAY AND OPERATION 1.9.1.4 Fourier graph This graph displays the frequency spectrum by performing digital Fourier conversion for the range of data displayed by the Y-time graph. Up to four draws can be displayed at a time. Displaying and setting the Fourier graph Procedure The proc
- Page 1561.DISPLAY AND OPERATION B-63945EN/01 3 Click the [OPERATION & GRAPH] soft key. The operation and graph setting screen is displayed as shown below. 4 Move the cursor to the parameter you want to set, by pressing the cursor key. 5 Enter data and the press the INPUT key. 6 Repeat steps 4 and 5 until yo
- Page 157B-63945EN/01 1.DISPLAY AND OPERATION 12 Click the [RE-DSPGRAPH] soft key. The wave display screen is displayed as shown below. - Changing the operation and graph setting screen The procedure for changing the operation and graph setting screen as necessary is described below. 1 Click the [OPERATION &
- Page 1581.DISPLAY AND OPERATION B-63945EN/01 5 Click the [RE-DSPGRAPH] soft key. Based on the new operation and graph settings, the wave display screen is displayed as shown below. - Changing the scale screen The procedure for changing the scale settings as necessary is described below. 1 Click the [SCALE S
- Page 159B-63945EN/01 1.DISPLAY AND OPERATION 5 Click the [RE-DSPGRAPH] soft key. Based on the new scale settings, the wave display screen is displayed as shown below. - Manipulating the Fourier graph By clicking the following soft keys, you can perform the operations corresponding to them. [MEASUREMENT] : P
- Page 1601.DISPLAY AND OPERATION B-63945EN/01 Explanation - Setting the operation and graph setting screen The operation and graph setting screen lets you specify up to four graph settings per draw. • Operation The specifiable values are as shown in Table 12.5.1.4(a), Fourier graph operations. An operation c
- Page 161B-63945EN/01 1.DISPLAY AND OPERATION 1.9.1.5 Bode graph This graph displays a Bode diagram for the measurement data in the form of a horizontal axis logarithm graph. Only one draw can be displayed at a time. Displaying and setting the Bode graph Procedure The procedure for displaying the measurement
- Page 1621.DISPLAY AND OPERATION B-63945EN/01 7 Click the [SAMPLING] soft key. The data-in screen is displayed as shown below. 8 Move the cursor to the parameter you want to set, by pressing the cursor key. 9 Enter data and the press the INPUT key. 10 Repeat steps 8 and 9 until you set all the parameters. 11
- Page 163B-63945EN/01 1.DISPLAY AND OPERATION 14 Repeat steps 12 and 13 until you set all the parameters. 15 Click the [RE-DSPGRAPH] soft key. 16 Click the [OPERATION & GRAPH] soft key. The operation and graph setting screen is displayed as shown below. 17 Move the cursor to the parameter you want to set, by
- Page 1641.DISPLAY AND OPERATION B-63945EN/01 23 Repeat steps 21 and 22 until you set all the parameters. 24 Click the [RE-DSPGRAPH] soft key. 25 Click the [MEASUREMENT] soft key. 26 Click the [START] soft key. 27 Start the automatic or manual operation. 28 When the measurement is completed, the wave display
- Page 165B-63945EN/01 1.DISPLAY AND OPERATION 3 Enter data and the press the INPUT key. 4 Click the [RE-DSPGRAPH] soft key. Based on the new operation and graph settings, the wave display screen is displayed as shown below. - Changing the scale screen The procedure for changing the scale settings as necessar
- Page 1661.DISPLAY AND OPERATION B-63945EN/01 5 Click the [RE-DSPGRAPH] soft key. Based on the new scale settings, the wave display screen is displayed as shown below. - Manipulating the Bode graph By clicking the following soft keys, you can perform the operations corresponding to them. [MEASUREMENT] : Perf
- Page 167B-63945EN/01 1.DISPLAY AND OPERATION - Performing measurement When you click the [MEASUREMENT] soft key, you can perform the operations corresponding to the menu items that follow. [START] : Starts measurement. [ORIGIN] : Sets the origin value. [STOP] : Stops measurement. [DATA IN] : Specifies measu
- Page 1681.DISPLAY AND OPERATION B-63945EN/01 4 Click the [SAMPLING] soft key. The data-in screen is displayed as shown below. 5 Move the cursor to the parameter you want to set, by pressing the cursor key. 6 Enter data and the press the INPUT key. 7 Repeat steps 5 and 6 until you set all the parameters. 11
- Page 169B-63945EN/01 1.DISPLAY AND OPERATION 11 Repeat steps 9 and 10 until you set all the parameters. 12 Click the [RE-DSPGRAPH] soft key. The wave display screen is displayed as shown below. 13 The new settings will take effect next time you perform measurement. Change the operation/graph settings and sc
- Page 1701.DISPLAY AND OPERATION B-63945EN/01 - Setting the operation and graph setting screen The operation and graph setting screen lets you specify graph settings. • Operation The specifiable values are as shown in Table 12.5.1.5(b), Bode graph operations. An operation cannot be specified if it does not m
- Page 171B-63945EN/02 2.LCD-MOUNTED TYPE Series 30i HARDWARE 2 LCD-MOUNTED TYPE Series 30i HARDWARE 2.1 STRUCTURE...........................................................................144 2.2 OVERVIEW OF HARDWARE...............................................145 2.3 TOTAL CONNECTION DIAGRAMS ............
- Page 1722.LCD-MOUNTED TYPE Series 30i HARDWARE B-63945EN/02 2.1 STRUCTURE Control/LCD unit MDI unit Optical cable Servo motor Servo amplifier I/O Link Distributed I/O module, I/O Unit MODEL-A Machine operator’s panel/ Power magnetics circuit etc. - 144 -
- Page 173B-63945EN/02 2.LCD-MOUNTED TYPE Series 30i HARDWARE 2.2 OVERVIEW OF HARDWARE Main board - CPU for controlling CNC - Power supply - 2-axis to 24-axis control - Spindle interface - LCD/MDI interface - I/O Link - PMC control function - High-speed DI - RS-232C - Memory card interface - PC function (300i
- Page 1742.LCD-MOUNTED TYPE Series 30i HARDWARE B-63945EN/02 2.3 TOTAL CONNECTION DIAGRAMS LCD display unit Main board 24V-IN(CPD16A) 24 VDC power supply MDI UNIT MDI(CA55) CK27 R232-1(JD56A) RS-232-C I/O unit 5th and 6th serial spindles R232-2(JD36A) RS-232-C I/O unit Touch panel HDI(JA40) High-peed skip in
- Page 175B-63945EN/02 2.LCD-MOUNTED TYPE Series 30i HARDWARE When optional functions are provided Additional spindle board Optional slot SPDL(JA41L) PSM Position coder 7th spindle SPM Additional axis board To 8th spindle FSSB(COP10A-3) COP10B SVM Servo motor COP10A COP10B SVM Servo motor COP10A COP10B SVM Se
- Page 1762.LCD-MOUNTED TYPE Series 30i HARDWARE B-63945EN/02 When optional functions are provided Fast data server Optional slot board ATA card The user should provide an ATA card. ETHERNET(CD38R) Ethernet HSSB ボード HSSB(COP21N) Personal Computer or PANEL i (Note 1) Profibus master board PROFI(CN1) Another NC
- Page 177B-63945EN/02 2.LCD-MOUNTED TYPE Series 30i HARDWARE 2.4 CONFIGURATION OF PRINTED CIRCUIT BOARD CONNECTORS AND CARDS 2.4.1 Main Board - Specification Name CNC model Specification Main board for 7.2”/8.4”/10.4” 30i-A, 31i-A5 A20B-8100-0980 display unit 31i-A, 32i-A A20B-8100-0981 32i-A (without Ethern
- Page 1782.LCD-MOUNTED TYPE Series 30i HARDWARE B-63945EN/02 - Connector mounting location (1) Main board for 7.2”/8.4”/10.4” display unit Connector unit Fan motor Fan motor Battery Rear of unit COP10A-1 COP10A-2 (COP10A is a connector installed on the servo card.) CA55 JD56A JA40 JA41 CD38A CK20A CK21A CDP1
- Page 179B-63945EN/02 2.LCD-MOUNTED TYPE Series 30i HARDWARE Connector number Application COP10A-1, COP10A-2 Servo amplifier (FSSB) CA55 MDI JD56A RS-232C serial port 1/serial spindle JD36A RS-232C serial port 2 JA40 High-speed DI JD51A I/O Link JA41 Serial spindle CPD16A DC24V-IN JGM Back panel interface CA
- Page 1802.LCD-MOUNTED TYPE Series 30i HARDWARE B-63945EN/02 (2) Main board for 15” display unit Connector unit Fan motor Fan motor Battery Rear of unit (COP10A-1 and COP10A-2 are connectors COP10A-1 COP10A-2 installed on the servo card.) CA55 (FUSE) JD56A JA40 JA41 Power supply module COP CD38S JD54 JD51A C
- Page 181B-63945EN/02 2.LCD-MOUNTED TYPE Series 30i HARDWARE Connector number Application COP10A-1, COP10A-2 Servo amplifier (FSSB) CA55 MDI JD56A RS-232C SERIAL PORT 1/serial spindle JD54 RS-232C SERIAL PORT 2 JA40 High-speed DI JD51A I/O Link JA41 Serial spindle CPD16A DC24V-IN JGM Back panel interface CA9
- Page 1822.LCD-MOUNTED TYPE Series 30i HARDWARE B-63945EN/02 - Card and power supply mounting location (1) Main board for 7.2”/8.4”/10.4” display unit Connector Connector (1) Axis control card (2) CPU card Connector (3) Power supply unit No. Name Specification Function Remarks HRV2 : Up to 4 axes A20B-3300-0
- Page 183B-63945EN/02 2.LCD-MOUNTED TYPE Series 30i HARDWARE No. Name Specification Function Remarks A20B-3300-0477 Standard version DRAM 32MB A20B-3300-0474 Standard version DRAM 64MB A20B-3300-0475 Standard version DRAM 128MB A20B-3300-0470 High-speed version (2) CPU card DRAM 64MB A20B-3300-0471 High-spee
- Page 1842.LCD-MOUNTED TYPE Series 30i HARDWARE B-63945EN/02 (2) Main board for 15” display unit Connector Connector Connector (1) Axis control card (2) CPU card (3) Display control card コネクタ Connector (4) Power supply unit No. Name Specification Function Remarks HRV2 : Up to 4 axes A20B-3300-0445 HRV3 : Up
- Page 185B-63945EN/02 2.LCD-MOUNTED TYPE Series 30i HARDWARE No. Name Specification Function Remarks Display control For 15” color LCD (3) A20B-3300-0420 card display unit Power supply (4) A20B-8101-0010 unit Configuration of the display control card In the display control card, a compact flash card is insta
- Page 1862.LCD-MOUNTED TYPE Series 30i HARDWARE B-63945EN/02 - DIMM module mounting location (1) Main board for 7.2”/8.4”/10.4” display unit (1) PMC module (2) FROM/SRAM module Connector Connector DIMM module socket No. Name Specification Function Remarks (1) PMC module A20B-3900-0200 A20B-3900-0160 FROM 16M
- Page 187B-63945EN/02 2.LCD-MOUNTED TYPE Series 30i HARDWARE (2) Main board for 15” display unit (1) PMC module (2) FROM/SRAM DIMM module module socket Connector Connector Connector コネクタ Connector No. Name Specification Function Remarks (1) PMC module A20B-3900-0200 A20B-3900-0160 FROM 16MB SRAM 1MB A20B-390
- Page 1882.LCD-MOUNTED TYPE Series 30i HARDWARE B-63945EN/02 - Block diagram (1) Main board for 7.2”/8.4”/10.4” display unit Main board CPU card CPU DRAM BOOT I/O Link software 3,4ch control I/O Link 4ch To back panel Axis control card Display Peripheral Ethernet PMC module control control control I/O Link 1
- Page 189B-63945EN/02 2.LCD-MOUNTED TYPE Series 30i HARDWARE (2) Main board for 15” display unit Main board Display control card CPU card Display DRAM CPU control CPU DRAM BOOT I/O Link software 3,4ch BOOT Compact control software Flash card I/O Link 4ch Peripheral control 2 To back panel Axis control card P
- Page 1902.LCD-MOUNTED TYPE Series 30i HARDWARE B-63945EN/02 - LED display (1) Main board for 7.2”/8.4”/10.4” display unit Rear of unit (a) Alarm (red) (b) Ethernet status (green) ALM1 ALM2 ALM3 LOW LINK COM (c) 7-segment LED (green) (yellow) - 162 -
- Page 191B-63945EN/02 2.LCD-MOUNTED TYPE Series 30i HARDWARE (a) Alarm LED (red) indication at system alarm occurrence If any of these LEDs lights, it is likely that the hardware is defective. Alarm LED No. Meaning 3 2 1 Low battery voltage. 1 The battery may be is running out. 2 Software detected an error a
- Page 1922.LCD-MOUNTED TYPE Series 30i HARDWARE B-63945EN/02 (2) Main board for 15” display unit Rear of unit Power supply COP module (c) Alarm (red) (b) Display control status (green) (d) Display control POWER (green) DNV4 DNV5 DNV3 (f) 7-segment LED DNV2 DNV1 (e) Ethernet status (yellow) (a) CNC alarm (red
- Page 193B-63945EN/02 2.LCD-MOUNTED TYPE Series 30i HARDWARE (a) Alarm LED (CNC alarm red LED) indication at CNC system alarm occurrence If any of these LEDs lights, it is likely that the hardware is defective. Alarm LED No. Meaning 3 2 1 Low battery voltage. 1 The battery may be running out. 2 Software dete
- Page 1942.LCD-MOUNTED TYPE Series 30i HARDWARE B-63945EN/02 (c) LED (red) indication at display control system alarm occurrence If the LED lights, it is likely that the hardware is defective. Alarm LED Meaning Common RAM error. DNV4 The main board may be faulty. (d) Display control POWER (green LED) indicat
- Page 195B-63945EN/02 2.LCD-MOUNTED TYPE Series 30i HARDWARE - Jumper plug setting (1) Main board for 7.2”/8.4”/10.4” display unit TMBB(Short) Ensure that this is short-circuited. Main board (2) Main board for 15” display unit Main board Power supply module TMIBB(Short) RESERVE(OPEN) Ensure that this is shor
- Page 1962.LCD-MOUNTED TYPE Series 30i HARDWARE B-63945EN/02 2.4.2 Inverter PCBs and Connector Units Name Specification Inverter P.C.B. For 7.2” color LCD A20B-8100-0961 For 15” color LCD A20B-8100-0963 For 15” color LCD A20B-8100-0962 For 15” color LCD A14L-0143-0002#A Fan adapter PCB For 15” color LCD A20B
- Page 197B-63945EN/02 2.LCD-MOUNTED TYPE Series 30i HARDWARE - Configuration of the inverter For 7.2"/8.4"/10.4"LCD Main board Inverter (fan adapter as well) CA87A 10.4”LCD CP1 CN1 CPD12(when A20B-8101-002x) For 15.0”LCD Fan adapter CN1 15.0”LCD Inverter unit CN02 CN01 CN03 CN04 CN05 Conversion cable - 169 -
- Page 1982.LCD-MOUNTED TYPE Series 30i HARDWARE B-63945EN/02 - Locations of the inverter and connector unit for 7.2"/8.4"/10.4" LCD inverter Connector unit Fan motor Fan motor Battery Rear of unit - 170 -
- Page 199B-63945EN/02 2.LCD-MOUNTED TYPE Series 30i HARDWARE - Locations of the inverter, fan adapter, and connector unit for 15” LCD Fan adaoter PCB Connector unit Inverter Rear view Rear of unit COP10A-1 Power supply COP module Conversion cable (A660-4042-T047) Two types of connectors are provided on the i
- Page 2002.LCD-MOUNTED TYPE Series 30i HARDWARE B-63945EN/02 2.5 LIST OF UNITS AND PRINTED CIRCUIT BOARDS 2.5.1 Basic Unit Model Name Drawing number Remarks 30i-A Basic Unit (No slot) A02B-0303-B500 Basic Unit (2 slots) A02B-0303-B502 31i-A5 Basic Unit (No slot) A02B-0306-B500 Basic Unit (2 slots) A02B-0306-
- Page 201B-63945EN/02 2.LCD-MOUNTED TYPE Series 30i HARDWARE 2.5.4 Printed Circuit Boards Name Drawing number ID Remarks 30i-A, 31i-A5 main board A20B-8100-0980 00301 (for 7.2”/8.4”/10.4” LCD) 31i-A, 32i-A main board A20B-8100-0981 00302 (for 7.2”/8.4”/10.4” LCD) 32i-A main board A20B-8100-0982 00303 (for 7.
- Page 2022.LCD-MOUNTED TYPE Series 30i HARDWARE B-63945EN/02 Name Drawing number ID Remarks FROM/SRAM module A20B-3900-0166 FROM: C3 (FROM 64MB, SRAM 1MB) SRAM: 03 FROM/SRAM module A20B-3900-0167 FROM: C3 (FROM 64MB, SRAM 2MB) SRAM: 04 FROM/SRAM module A20B-3900-0180 FROM: C1 (FROM 16MB, SRAM 256kB) SRAM: 01
- Page 203B-63945EN/02 2.LCD-MOUNTED TYPE Series 30i HARDWARE Name Drawing number Remarks Distributed I/O connector panel I/O A03B-0815-C003 DI/DO: 24/16 expansion module B Distributed I/O connector panel I/O A03B-0815-C004 DO: 16 (2A expansion module C output ) Distributed I/O connector panel I/O A03B-0815-C
- Page 2042.LCD-MOUNTED TYPE Series 30i HARDWARE B-63945EN/02 2.6 REPLACING THE MAIN BOARD WARNING Only those personnel who have received approved safety and maintenance training may perform this replacement work. When opening the cabinet and replacing the board, be careful not to touch the high-voltage circu
- Page 205B-63945EN/02 2.LCD-MOUNTED TYPE Series 30i HARDWARE Claw Screws Note) The screws are locked so as not to be detached from the case. 3 Detach the cables from the connectors CA88A (PCMCIA interface connector), CA79A (video signal interface connector), and CK20A and CK21A (connectors for soft keys) on
- Page 2062.LCD-MOUNTED TYPE Series 30i HARDWARE B-63945EN/02 2.7 REPLACING FUSE ON CONTROL UNIT WARNING Before replacing a blown fuse, locate and remove the cause of the blown fuse. For this reason, only those personnel who have received approved safety and maintenance training may perform this replacement w
- Page 207B-63945EN/02 2.LCD-MOUNTED TYPE Series 30i HARDWARE - Fuse mounting location for 15” LCD Rear view Rear of unit Power supply COP module Fuse Ordering code Rating A02B-0236-K101 7.5A - 179 -
- Page 2082.LCD-MOUNTED TYPE Series 30i HARDWARE B-63945EN/02 2.8 REPLACING BATTERY Offset data, and system parameters are stored in SRAM in the control unit. The power to the SRAM is backed up by a lithium battery mounted on the front panel of the control unit. The above data is not lost even when the main b
- Page 209B-63945EN/02 2.LCD-MOUNTED TYPE Series 30i HARDWARE Connector Battery case Lithium battery A02B-0200-K102 When a unit with no option slot is used Battery case Connector Lithium battery A02B-0236-K102 When a unit with option slots is used Battery cable Clamping battery cables - 181 -
- Page 2102.LCD-MOUNTED TYPE Series 30i HARDWARE B-63945EN/02 WARNING Using other than the recommended battery may result in the battery exploding. Replace the battery only with the specified battery (A02B-0200-K102). CAUTION Steps 1 to 3 should be completed within 30 minutes. Do not leave the control unit wi
- Page 211B-63945EN/02 2.LCD-MOUNTED TYPE Series 30i HARDWARE When using commercial alkaline dry cells (size D) - Method of connection Power from the external batteries is supplied through the connector to which the lithium battery is connected. The lithium battery, provided as standard, can be replaced with
- Page 2122.LCD-MOUNTED TYPE Series 30i HARDWARE B-63945EN/02 Replacing commercial alkaline dry cells (size D) 1 Prepare two alkaline dry cells (size D) commercially available. 2 Turn on the power to the control unit. 3 Remove the battery case cover. 4 Replace the cells, paying careful attention to their orie
- Page 213B-63945EN/02 2.LCD-MOUNTED TYPE Series 30i HARDWARE 2.9 REPLACING FAN MOTORS WARNING When opening the cabinet and replacing a fan motor, be careful not to touch the high-voltage circuits (marked and fitted with an insulating cover). Touching the uncovered high-voltage circuits presents an extremely
- Page 2142.LCD-MOUNTED TYPE Series 30i HARDWARE B-63945EN/02 Replacement procedure - For units with no expansion slots 1 Before replacing a fan motor, turn off the power to the CNC. 2 Unplug the connector of a fan motor to be replaced ((1) of Fig. a). The connector is latched. Unplug the connector while hold
- Page 215B-63945EN/02 2.LCD-MOUNTED TYPE Series 30i HARDWARE - For units with 2 expansion slots 1 Before replacing a fan motor, turn off the power to the CNC. 2 Unplug the connector of a fan motor to be replaced ((1) of Fig. b). The connector is latched. Unplug the connector while holding down the latch plac
- Page 2163.LCD-MOUNTED TYPE Series 300is/310is/320is HARDWARE B-63945EN/02 3 LCD-MOUNTED TYPE Series 300is/310is/320is HARDWARE This chapter describes the printed circuit boards in the LCD-mounted type Series 300is/310is/320is control units, the functions of the card PCBs on the printed circuit boards, and t
- Page 217B-63945EN/02 3.LCD-MOUNTED TYPE Series 300is/310is/320is HARDWARE 3.1 HARDWARE CONFIGURATION See section 2.1 for hardware configuration of Series 300is/310is/320is. 3.2 HARDWARE OVERVIEW See section 2.2 for hardware overview of Series 300is/310is/320is. - 189 -
- Page 2183.LCD-MOUNTED TYPE Series 300is/310is/320is HARDWARE B-63945EN/02 3.3 TOTAL CONNECTION DIAGRAMS For the 300is/310is/320is, the following connection is required, in addition to the connection common to the 30i/300is/31is/310is/32i/310is. 300is/310is/320is control unit 24V-IN(CPD16A) SPDL (JA41) I/O L
- Page 219B-63945EN/02 3.LCD-MOUNTED TYPE Series 300is/310is/320is HARDWARE 3.4 CONFIGURATION OF PRINTED CIRCUIT BOARD CONNECTORS AND CARDS 3.4.1 Main Board - Specification Item Specification Series 300is main board (10.4") A20B-8101-0020 Series 300is main board (12.1") A20B-8101-0023 Series 300is main board
- Page 2203.LCD-MOUNTED TYPE Series 300is/310is/320is HARDWARE B-63945EN/02 - Connector mounting location Connector unit Fan motor Fan motor Battery Rear view Rear of unit (COP10A-1 and COP10A-2 are connectors installed on the servo card.) COP10A-1 COP10A-2 CA76 CA55 (FUSE) JA40 JA41 Power COP supply unit CD3
- Page 221B-63945EN/02 3.LCD-MOUNTED TYPE Series 300is/310is/320is HARDWARE Connector number Application COP10A-1, COP10A-2 Servo amplifier (FSSB) CA55 MDI JD56A RS-232C serial port 1/serial spindle JD54 RS-232C serial port 2/USB JA40 High-speed DI JD51A I/O link JA41 Serial spindle CPD16A DC24V-IN JGM Back p
- Page 2223.LCD-MOUNTED TYPE Series 300is/310is/320is HARDWARE B-63945EN/02 - Card and power supply mounting location Connector Connector Connector (1) Axis control card (2) CPU card (3) Display control card コネクタ Connector (4) Power supply unit No. Name Specification Function Remarks HRV2 : Up to 4 axes A20B-
- Page 223B-63945EN/02 3.LCD-MOUNTED TYPE Series 300is/310is/320is HARDWARE Configuration of GUI card Compact flash card Connector GUI card Compact flash (connector side) card socket Name Specification Remarks GUI card 1 10.4” /15"LCD A20B-3300-0420 64MB 10.4” /15"LCD A20B-3300-0421 128MB 12.1” LCD A20B-3300-
- Page 2243.LCD-MOUNTED TYPE Series 300is/310is/320is HARDWARE B-63945EN/02 - DIMM module mounting location (1) PMC module (2) FROM/SRAM module DIMM module socket Connector Connector Connector コネクタ Connector No. Name Specification Function Remarks (1) PMC module A20B-3900-0200 A20B-3900-0160 FROM 16MB SRAM 1M
- Page 225B-63945EN/02 3.LCD-MOUNTED TYPE Series 300is/310is/320is HARDWARE - Block diagram Main board Display control card CPU card DRAM Display CPU control CPU DRAM BOOT I/O Link software 3,4ch BOOT Compact control software Flash card I/O Link 4ch Peripheral control 2 To back panel Axis control card Periphe
- Page 2263.LCD-MOUNTED TYPE Series 300is/310is/320is HARDWARE B-63945EN/02 - LED display Rear view Rear of unit (3) Alarm (red) DNV5 DNV4 (2) GUI status (green) DNV3 (4) GUI POWER (green) DNV2 DNV1 (5) 7-segment LED (1) CNC alarm (red) LOW ALM3 ALM2 ALM1 - 198 -
- Page 227B-63945EN/02 3.LCD-MOUNTED TYPE Series 300is/310is/320is HARDWARE (1) Alarm LED (CNC alarm red LED) indication at CNC system alarm occurrence If any of these LEDs lights, it is likely that the hardware is defective. CNC alarm No. LED Status 3 2 1 Low battery voltage. 1 The battery may be is running
- Page 2283.LCD-MOUNTED TYPE Series 300is/310is/320is HARDWARE B-63945EN/02 (3) Alarm LED (red) indication at GUI system alarm occurrence If the LED lights, it is likely that the hardware is defective. Alarm LED Meaning Common RAM error. DNV4 The main board may be faulty. : On : Off (4) GUI POWER (green LED)
- Page 229B-63945EN/02 3.LCD-MOUNTED TYPE Series 300is/310is/320is HARDWARE 3.4.2 Inverter PCBs, Connector Units, and Fan Adapter PCBs Name Specification Inverter PCB For 10.4” color LCD A20B-8100-0962 (Used also as the fan adapter) For 12” color LCD A14L-0143-0003#A (With an inverter main board cable) For 15
- Page 2303.LCD-MOUNTED TYPE Series 300is/310is/320is HARDWARE B-63945EN/02 - Details of the inverter Display unit main board for is series CNC (A20B-8101-006x) For 10.4” LCD 10.4” LCD unit Inverter (fan adapter as well) CA87A CP1 CN1 CPD12 For 12.1” LCD Fan adapter CN1 12.1” LCD unit Inverter CN2 CN1 CN3 For
- Page 231B-63945EN/02 3.LCD-MOUNTED TYPE Series 300is/310is/320is HARDWARE - Inverter PCBs, connector units, and fan adapter PCBs (1) For 10.4” LCD Inverter PCB Connector unit Rear view Rear of unit COP (2) For 12.1” LCD Fan adapter PCB Connector unit Inverter Rear view Rear of unit COP - 203 -
- Page 2323.LCD-MOUNTED TYPE Series 300is/310is/320is HARDWARE B-63945EN/02 (3) For 15” LCD Fan adapter PCB Connector unit Inverter Rear view Rear of unit COP - Conversion cable for the inverter When a 15" LCD is used, a conversion cable needs to be run between the LCD backlight cable and the inverter connect
- Page 233B-63945EN/02 3.LCD-MOUNTED TYPE Series 300is/310is/320is HARDWARE 3.5 LIST OF PRINTED CIRCUIT BOARDS AND UNITS 3.5.1 List of Printed Circuit Boards Name Ordering code Remarks Main board Series 300is For 10.4" LCD A20B-8101-0020 ID=00304 For 12.1" LCD A20B-8101-0023 ID=00307 For 15" LCD A20B-8101-002
- Page 2343.LCD-MOUNTED TYPE Series 300is/310is/320is HARDWARE B-63945EN/02 3.5.3 Others Name Ordering code Remarks Compact flash card 32MB A87L-0001-0173#032MBA 64MB A87L-0001-0173#064MB 128MB A87L-0001-0173#128MB 256MB A87L-0001-0173#256MB Conversion cable (for 15" LCD backlight) A660-4042-T047 Cable for ba
- Page 235B-63945EN/02 3.LCD-MOUNTED TYPE Series 300is/310is/320is HARDWARE 3.6 REPLACING THE MAIN BOARD WARNING Only those personnel who have received approved safety and maintenance training may perform this replacement work. When opening the cabinet and replacing the board, be careful not to touch the high
- Page 2363.LCD-MOUNTED TYPE Series 300is/310is/320is HARDWARE B-63945EN/02 3.6.1 Replacement Procedure 1 Remove the LCD-mounted type control unit, referencing Section 5.13, “MOUNTING AND REMOVING LCD AND MDI UNITS.” 2 Remove the two screws at the bottom of the case, then remove the case while pushing down th
- Page 237B-63945EN/02 3.LCD-MOUNTED TYPE Series 300is/310is/320is HARDWARE 4 Next, remove the screws used to secure the main board. The connector CA87A (connector for inverter connection) directly connects the main board with the inverter PCB. So, detach the main board by moving the main board downward. CA79
- Page 2383.LCD-MOUNTED TYPE Series 300is/310is/320is HARDWARE B-63945EN/02 3.7 REPLACING FUSE ON UNIT WARNING Before replacing a blown fuse, locate and remove the cause of the blown fuse. For this reason, only those personnel who have received approved safety and maintenance training may perform this replace
- Page 239B-63945EN/02 3.LCD-MOUNTED TYPE Series 300is/310is/320is HARDWARE 3.8 REPLACING THE BATTERY See Section 2.8, "REPLACING THE BATTERY" for replacing the battery. 3.9 REPLACING THE FAN MOTOR See Section 2.9, "REPLACING FAN MOTORS" for replacing the fan motor. 3.10 REPLACING THE TOUCH PANEL PROTECTION S
- Page 2403.LCD-MOUNTED TYPE Series 300is/310is/320is HARDWARE B-63945EN/02 3.11 BACKUP UNIT - Specification Name Specification Backup unit PCB A20B-2100-0820 Backup unit cable A02B-0281-K801 - Mounting positions of connectors CN9 Backup unit PCB Front view Connector name Function CN9 Supplying the backup pow
- Page 241B-63945EN/02 4.STAND-ALONE TYPE 30i SERIES HARDWARE 4 STAND-ALONE TYPE 30i SERIES HARDWARE This chapter describes the printed circuit boards of the CNC control unit of the stand-alone type 30i series and card PCB functions on the printed circuit boards. The chapter also describes procedures for repl
- Page 2424.STAND-ALONE TYPE 30i SERIES HARDWARE B-63945EN/02 4.1 HARDWARE CONFIGURATION Display unit MDI unit Control unit Servo motor Servo amplifier Optical cable Distributed I/O module, I/O unit MODEL-A, etc. I/O Link Machine operator's panel, power magnetic circuit, etc. - 214 -
- Page 243B-63945EN/02 4.STAND-ALONE TYPE 30i SERIES HARDWARE 4.2 HARDWARE OVERVIEW 4 slot rack 2 slot rack Main board Slot 3 Slot 1 Slot 4 Slot 2 Options (Slot 1 to 4) Basic system Data server board Main board Data server function - CPU for controlling CNC - Power supply Additional axis board - 2-axis to 24-
- Page 2444.STAND-ALONE TYPE 30i SERIES HARDWARE B-63945EN/02 4.3 TOTAL CONNECTION DIAGRAMS Main board Slot 1 24V-IN(CPD19A) 24 VDC power supply 24V-OUT(CPD19B) To I/O device Optical fiber ccable LCD UNIT MDI UNIT COP21A,B,M DISPLAY(COP21A) 24VDC CP1A CA55 CK27 CP1B Memory card (Touch panel) PANEL i or person
- Page 245B-63945EN/02 4.STAND-ALONE TYPE 30i SERIES HARDWARE When optional functions are provided Additional spindle board Optional slot SPDL(JA41L) PSM Position coder 7th spindle SPM Additional axis board To 8th spindle FSSB(COP10A-3) COP10B SVM Servo motor COP10A COP10B SVM Servo motor COP10A COP10B SVM Se
- Page 2464.STAND-ALONE TYPE 30i SERIES HARDWARE B-63945EN/02 When optional functions are provided Fast data server Optional slot board ATA card The user should provide an ATA card. ETHERNET(CD38R) Ethernet HSSB ボード HSSB(COP21N) Personal Computer or PANEL i (Note 1) Profibus master board PROFI(CN1) Another NC
- Page 247B-63945EN/02 4.STAND-ALONE TYPE 30i SERIES HARDWARE For the is series CNC display unit, the additional connection shown below is required on the unit. CNC control unit Main board HSSB(COP21A) MDI unit (CK27) Display unit for is series CNC 24VDC power supply MDI(CA55) HSSB(COP21M) 24V-IN(CDP18) { RS-
- Page 2484.STAND-ALONE TYPE 30i SERIES HARDWARE B-63945EN/02 4.4 CONNECTOR AND CARD CONFIGURATIONS OF PRINTED CIRCUIT BOARDS 4.4.1 Main CPU Board of 30i series - Specifications Item Ordering code Main CPU board of 30i/300i/300is-A A16B-3200-0520 Main CPU board of 31i/310i/310is-A5 Main CPU board of 31i/310i/
- Page 249B-63945EN/02 4.STAND-ALONE TYPE 30i SERIES HARDWARE STATUS 7-segment LED: This LED usually indicates the state of the CNC. This LED is used also for setting and maintenance using the rotary switch MTSW and the push switch PSW. MTSW rotary switch: This rotary switch is used for setting and maintenanc
- Page 2504.STAND-ALONE TYPE 30i SERIES HARDWARE B-63945EN/02 No. Item Ordering code Function Remarks HRV2 : Up to 4 axes A20B-3300-0445 HRV3 : Up to 3 axes HRV4 : Up to 1 axis HRV2 : Up to 8 axes The maximum A20B-3300-0448 HRV3 : Up to 6 axes number of axes is HRV4 : Up to 2 axes also limited HRV2 : Up to 12
- Page 251B-63945EN/02 4.STAND-ALONE TYPE 30i SERIES HARDWARE - Block diagram Main board CPU card CPU DRAM BOOT I/O Link software 3,4ch control I/O Link 4ch To back panel Axis control card Display Peripheral Ethernet PMC module control control control I/O Link 1,2ch control DIMM module FROM/SRAM Power supply
- Page 2524.STAND-ALONE TYPE 30i SERIES HARDWARE B-63945EN/02 - LED display LED for embedded Ethernet LINK (Upper, green) COM (Lower, yellow) FUSE ALM : Fuse burn-out detection LED STATUS : 7-Segment LED ALARM : Alarm LED 1 4 2 3 - 224 -
- Page 253B-63945EN/02 4.STAND-ALONE TYPE 30i SERIES HARDWARE (1) Alarm LED (red) display when a system alarm occurs If any of these LEDs lights, it is likely that the hardware is defective. Alarm LED No. Meaning 3 2 1 Low battery voltage. 1 The battery may be running out. 2 Software detected an error and sto
- Page 2544.STAND-ALONE TYPE 30i SERIES HARDWARE B-63945EN/02 4.4.2 PANEL i Printed Circuit Board - Specification Item Specification Mainboard (for 10” LCD) A20B-8100-0935 Mainboard (for 15” LCD) A20B-8100-0936 Back panel A20B-8002-0330 Power supply P.C.B. A20B-2100-0920 - Connector and LED mounting location
- Page 255B-63945EN/02 4.STAND-ALONE TYPE 30i SERIES HARDWARE (2) Back panel CA78B PCI Slot 2 LED2A LED1A CA78A PCI Slot 1 HSSB PCI I/F COP21M Controller JA64 PC Extension I/F (3) Power supply P.C.B. CPD14 CN3 CPE11B CPE11A CPD11A CPD11B CPD11C CPE11C FUSE CPD12 - 227 -
- Page 2564.STAND-ALONE TYPE 30i SERIES HARDWARE B-63945EN/02 - Block diagram Touch panel CD37 PCMCIA I/F PCMCIA Clock generator CA82 controller JA63 CRT USB I/F CD46L CPU CD34 FDD SIGNAL Memory DIMM CD32L KEYBOARD CNA1 Chipset CA85 (GMCH) LCD LVDS DV CD32U MOUSE signal line CA79 LVDS RV Chipset Chipset JD9 C
- Page 257B-63945EN/02 4.STAND-ALONE TYPE 30i SERIES HARDWARE Setting and adjustment points (1) Jumper pin setting Name Meaning Setting position Description TM1 FDD Short To use this PANEL i FDD, select operation TM1 this setting. It is mode factory-selected. Open To use the conventional FANUC TM1 FDD, select
- Page 2584.STAND-ALONE TYPE 30i SERIES HARDWARE B-63945EN/02 (3) LEDs on the main board GR5 GR4 GR6 RE2 RE3 RE1 CD41M CD32 GR3 GR2 GR1 Name 1 Name 2 Color Status RE1 TRM Red Temperature alarm. It is issued if a temperature outside a specified range is detected. RE2 BAT Red Battery alarm. It indicates that th
- Page 259B-63945EN/02 4.STAND-ALONE TYPE 30i SERIES HARDWARE 4.4.3 Display Unit for is Series CNC 4.4.3.1 Main board of display unit for is series CNC - Specification Item Specification Main board of display unit for is series CNC (15") A20B-8101-0061 Main board of display unit for is series CNC A20B-8101-00
- Page 2604.STAND-ALONE TYPE 30i SERIES HARDWARE B-63945EN/02 - Connector mounting location Connector unit Fan motor Fan motor Rear of unit CD38S CA75 CK20A COP21M CPD18 CK21A CA55 CPD12 JD54 JD36 CA79A CA98 CA87A CA76 Main board CA88A CA95 CD38S CA75 CD46L CK20A COP21M CPD18 CK21A CA55 CPD12 JD54 JD36 - 232
- Page 261B-63945EN/02 4.STAND-ALONE TYPE 30i SERIES HARDWARE Connector number Application CA55 MDI JD36 RS-232C serial port 1 JD54 RS-232C serial port 2/USB CPD18 DC24V-IN CA79A Video signal interface (10.4"/12.1”LCD only) CA98 Video signal interface (15" LCD only) CA88A PCMCIA interface CD46L USB interface
- Page 2624.STAND-ALONE TYPE 30i SERIES HARDWARE B-63945EN/02 - Card mounting location Connector (1) GUI card Connector (2)Power supply unit No. Name Specification Function Remarks (1) GUI card 10.4” /15"LCD A20B-3300-0420 64MB 10.4” /15"LCD A20B-3300-0421 128MB 12.1” LCD A20B-3300-0422 64MB 12.1"LCD A20B-330
- Page 263B-63945EN/02 4.STAND-ALONE TYPE 30i SERIES HARDWARE - Configuration of GUI card Compact flash card Connector GUI card Compact flash (connector side) card socket Name Specification Remarks GUI card 1 10.4” /15"LCD A20B-3300-0420 64MB 10.4” /15"LCD A20B-3300-0421 128MB 12.1” LCD A20B-3300-0422 64MB 12
- Page 2644.STAND-ALONE TYPE 30i SERIES HARDWARE B-63945EN/02 - Block diagram Main board GUI card DRAM Display control CPU BOOT Compact Flash software card Peripheral control Peripheral Power supply unit 2 control 1 5V, 3.3V, 2.5V USB control Ethernet control Display unit USB Ethernet RS232C 24VDC HSSB Memory
- Page 265B-63945EN/02 4.STAND-ALONE TYPE 30i SERIES HARDWARE - LED display Rear of unit Power supply unit LEDP COM LINK BSRDY (green) (green) LED1 LED2 (green) (green) (orange) (green) ALM2 (red) (1) LED display (HSSB) LED name Meaning BSRDY (green LED) Lights when the unit can communicate with the NC via th
- Page 2664.STAND-ALONE TYPE 30i SERIES HARDWARE B-63945EN/02 - Jumper plug setting RESERVE(OPEN) Ensure that this is left open. (The terminal may not be installed.) - 238 -
- Page 267B-63945EN/02 4.STAND-ALONE TYPE 30i SERIES HARDWARE 4.4.3.2 Inverter PCBs, Fan Adapter PCBs, and Connector Units Name Specification Inverter PCB For 10.4” color LCD A20B-8100-0962 (Used also as the fan adapter) For 12” color LCD A14L-0143-0003#A (With an inverter main board cable) For 15” color LCD
- Page 2684.STAND-ALONE TYPE 30i SERIES HARDWARE B-63945EN/02 - Details of the inverter Display unit main board for is series CNC (A20B-8101-006x) For 10.4” LCD 10.4” LCD unit Inverter (fan adapter as well) CA87A CP1 CN1 CPD12 For 12.1” LCD Fan adapter CN1 12.1” LCD unit Inverter CN2 CN1 CN3 For 15.0” LCD Fan
- Page 269B-63945EN/02 4.STAND-ALONE TYPE 30i SERIES HARDWARE - Inverter and connector units for 10.4” LCD Inverter PCB Connector unit Rear of unit - Inverter, fan adapter, and connector unit for 12.1” LCD Inverter PCB Fan adapter Connector unit Rear of unit - 241 -
- Page 2704.STAND-ALONE TYPE 30i SERIES HARDWARE B-63945EN/02 - Inverter, fan adapter, and connector unit for 15” LCD Inverter PCB Fan adapter Connector unit Rear of unit - Conversion cable for the inverter When a 15" LCD is used, a conversion cable needs to be run between the LCD backlight cable and the inve
- Page 271B-63945EN/02 4.STAND-ALONE TYPE 30i SERIES HARDWARE 4.5 LIST OF UNITS AND PRINTED CIRCUIT BOARDS 4.5.1 List of Basic Units Type Item Ordering code Remarks 30i/300i/ Basic unit with 2 slots A02B-0303-B802 300is-A Basic unit with 4 slots A02B-0303-B804 31i/310i/ Basic unit with 2 slots A02B-0306-B802
- Page 2724.STAND-ALONE TYPE 30i SERIES HARDWARE B-63945EN/02 Item Ordering code ID Remarks FROM/SRAM module A20B-3900-0160 FROM: C1 (FROM 16MB, SRAM 1MB) SRAM: 03 FROM/SRAM module A20B-3900-0161 FROM: C1 (FROM 16MB, SRAM 2MB) SRAM: 04 FROM/SRAM module A20B-3900-0163 FROM: C2 (FROM 32MB, SRAM 1MB) SRAM: 03 FR
- Page 273B-63945EN/02 4.STAND-ALONE TYPE 30i SERIES HARDWARE 4.5.4 List of Display Unit for 300i/310i/320i (PANEL i) Main printed circuit boards Unit LCD type Ordering code (main P.C.B.) Parent specification (basic unit) A20B-8100-0935 A08B-0084-B501 to 4 10.4” A13B-0196-B502, -B504 PANEL i A08B-0084-B521 to
- Page 2744.STAND-ALONE TYPE 30i SERIES HARDWARE B-63945EN/02 *2: The maintenance HDD unit includes a HDD fan but not a signal cable or a power cord. CAUTION A combination of hard disk, floppy disk, and CD-ROM drives may fail to operate normally if any of them is not recommended by FANUC. Base unit Unit LCD I
- Page 275B-63945EN/02 4.STAND-ALONE TYPE 30i SERIES HARDWARE Maintenance equipment Maintaining the unit or installing applications in it requires the following equipment. Item Ordering number Full-keyboard 101 key type A86L-0001-0210 (PS/2 I/F) 106 key type A86L-0001-0211 Mouse (PS/2 I/F) A86L-0001-0212 4.5.
- Page 2764.STAND-ALONE TYPE 30i SERIES HARDWARE B-63945EN/02 4.5.6 MDI Unit Model Item Ordering number ID Remarks 30i/31i/32i/ T series/English/Small A02B-0303-C120#T 04 300is/310is/ keyboard 320is For 7.2”/8.4”,ONG M series/English/Small A02B-0303-C120#M 08 keyboard For 7.2”/8.4”,ONG T series/English/Standa
- Page 277B-63945EN/02 4.STAND-ALONE TYPE 30i SERIES HARDWARE 4.5.7 I/O Item Ordering number Remarks Distributed I/O connector panel I/O A20B-2002-0470 DI/DO: 72/56, module A1 DI=general 16, matrix 56, with MPG interface Distributed I/O connector panel I/O A20B-2002-0520 DI/DO: 48/32, module B1 with MPG inter
- Page 2784.STAND-ALONE TYPE 30i SERIES HARDWARE B-63945EN/02 4.5.8 Other Units Item Ordering number Remarks Separate detector interface unit (4 A02B-0303-C205 basic axes) Separate detector interface unit (4 A02B-0236-C204 additional axes) Analog input separate detector A06B-6061-C201 interface unit (4 basic
- Page 279B-63945EN/02 4.STAND-ALONE TYPE 30i SERIES HARDWARE 4.6 REPLACING THE FUSE OF THE CONTROL UNIT WARNING Before starting the replacement of a fuse, remove the cause of the fuse burn-out. Accordingly, the replacement should be performed by a person fully trained in maintenance and safety. If the cabine
- Page 2804.STAND-ALONE TYPE 30i SERIES HARDWARE B-63945EN/02 4.7 REPLACING THE BATTERY Offset data, and system parameters are stored in SRAM in the control unit. The power to the SRAM is backed up by a lithium battery mounted on the front panel of the control unit. The above data is not lost even when the ma
- Page 281B-63945EN/02 4.STAND-ALONE TYPE 30i SERIES HARDWARE Battery case Lithium battery A02B-0200-K102 Connector WARNING The incorrect mounting of the battery may cause an explosion. Avoid using any battery other than the one specified here (A02B-0200-K102). CAUTION Complete steps 1 to 3 within 30 minutes.
- Page 2824.STAND-ALONE TYPE 30i SERIES HARDWARE B-63945EN/02 When using commercial D-size alkaline dry cells • General method Use the connector connected to the lithium battery for an external battery. Following the battery replacement procedure described above, replace the standard lithium battery with an e
- Page 283B-63945EN/02 4.STAND-ALONE TYPE 30i SERIES HARDWARE • Replacing the battery 1 Have commercial D-size alkaline dry cells handy. 2 Turn the CNC on. 3 Remove the lid from the battery case. 4 Replace the old dry cells with new ones. Mount the dry cells in a correct orientation. 5 Replace the lid on the
- Page 2844.STAND-ALONE TYPE 30i SERIES HARDWARE B-63945EN/02 4.8 REPLACING A FAN UNIT WARNING If the cabinet is opened to replace a fan unit, take extreme care not to touch any high-voltage area (marked with and covered by a shock prevention cover). If the area is uncovered, direct contact with this area wil
- Page 285B-63945EN/02 4.STAND-ALONE TYPE 30i SERIES HARDWARE - Replacing a fan unit Detaching a fan unit <1> When replacing the fan motor, be sure to turn off the power to the machine (CNC). <2> Push up the latch at the top of the unit until the latch is disengaged. Push up the latch. Latched Unlatched CAUTI
- Page 2864.STAND-ALONE TYPE 30i SERIES HARDWARE B-63945EN/02 Attaching a fan unit <1> Insert a fan unit deeply into the main unit at a slanted angle of about 30 degrees until the fan unit touches the wall of the main unit. <2> Lower the fan unit slowly on the main unit. <3> Push down the fan unit on the near
- Page 287B-63945EN/02 4.STAND-ALONE TYPE 30i SERIES HARDWARE 4.9 REPLACING THE FUSE OF THE DISPLAY UNIT WARNING Before starting the replacement of a fuse, remove the cause of the fuse burn-out. Accordingly, the replacement should be performed by a person fully trained in maintenance and safety. If the cabine
- Page 2884.STAND-ALONE TYPE 30i SERIES HARDWARE B-63945EN/02 Display unit for 30i/31i/32i Fan motor Fan motor Rear view Power supply unit Fuse Ordering code Rating A02B-0236-K100 5A - 260 -
- Page 289B-63945EN/02 4.STAND-ALONE TYPE 30i SERIES HARDWARE 4.10 REPLACING PANEL i MAINTENANCE PARTS 4.10.1 Replacing the Battery NOTE Insert a new battery within 5 minutes after the old battery is removed from the connector. Usually, following the battery replacement procedure stated below will not lose th
- Page 2904.STAND-ALONE TYPE 30i SERIES HARDWARE B-63945EN/02 4.10.2 Removing the Case Cover If you spend 5 minutes or more in removing the battery, it is likely that the BIOS settings may be lost. Should they be lost, the messages “251: System CMOS checksum bad – Default configuration used.” and “Press
- Page 291B-63945EN/02 4.STAND-ALONE TYPE 30i SERIES HARDWARE (3) Detaching the PCI card <2> <1> <1> Remove the PCI holding part. <2> Remove the screw, and pull out the PCI card. (4) Removing screws from the case a b d c e Note) Screws a to c are locked so that they will not drop off the case. <1> For units o
- Page 2924.STAND-ALONE TYPE 30i SERIES HARDWARE B-63945EN/02 (5) Checking the shape of the PCI holding plate at the bottom of the unit <1> Old type <2> New type <1> If the holding plate is an old type, remove it first. <2> If the holding plate is a new type, remove the screw indicated with an arrow, and loos
- Page 293B-63945EN/02 4.STAND-ALONE TYPE 30i SERIES HARDWARE (8) Removing the cover - 265 -
- Page 2944.STAND-ALONE TYPE 30i SERIES HARDWARE B-63945EN/02 4.10.3 Mounting the Case Cover (1) Position the upper side of the cover in the right place, and lower it. Be careful. They are tight. Be careful not to have the case cover caught on Make sure that the power supply PCB and the DIMM latch. backplane
- Page 295B-63945EN/02 4.STAND-ALONE TYPE 30i SERIES HARDWARE (4) Attach the cable connector. 40-mm-square fan 60-mm-square fan Battery (5) Attach the LCD cable, and mount the metal fitting and cable clamp. (For the 15.0” LCD unit only) - 267 -
- Page 2964.STAND-ALONE TYPE 30i SERIES HARDWARE B-63945EN/02 4.10.4 Replacing the Fuse NOTE First find out what caused the fuse to blow, and then remove the cause. The fuse blows if there is a short-circuit in the PANEL i . If the fuse has blown, check to see if: • A conductor has touched the main printed-ci
- Page 297B-63945EN/02 4.STAND-ALONE TYPE 30i SERIES HARDWARE 4.10.5 Replacing the Fan 4.10.5.1 Replacing the fan in the PANEL i 1 Turn off the power to the PANEL i. 2 Get a new fan ready. 3 Detach the connector from the fan in the PANEL i. The connector is latched. Pull it out by unlatching it with a flat-bl
- Page 2984.STAND-ALONE TYPE 30i SERIES HARDWARE B-63945EN/02 4.10.5.2 Replacing the fan for the HDD 1 Turn off the power to the PANEL i. 2 Get a new fan ready. 3 Remove the fan connector (CPE11C) from the power supply board. The connector is latched. Detach it by pulling it up slightly to unlatch. 4 Remove t
- Page 299B-63945EN/02 4.STAND-ALONE TYPE 30i SERIES HARDWARE 4.10.6 Replacing the CPU Unit 1 Turn off the power to the PANEL i. 2 Remove the cover. (See Section 5.2.) 3 Remove two screws and the CPU holding plate (A). 4 Lift the CPU socket lever, and detach the CPU unit (B). 5 Mount a new CPU unit, and rever
- Page 3004.STAND-ALONE TYPE 30i SERIES HARDWARE B-63945EN/02 4.10.7 Replacing the LCD Backlight NOTE For the 15.0” LCD type, it is impossible to replace the backlight independently. It must be replaced together with the maintenance base unit (A08D-0084-Dxxx). 4.10.7.1 Replacing the 10.4” LCD backlight 1 Turn
- Page 301B-63945EN/02 4.STAND-ALONE TYPE 30i SERIES HARDWARE 5 Remove two screws, and detach the CPU holding plate. Remove two screws, and detach the PCI holding plate (if it has not been detached). Also remove three screws, the soft key cable, PCMCIA cable, and USB cable, and then detach the printed-circuit
- Page 3024.STAND-ALONE TYPE 30i SERIES HARDWARE B-63945EN/02 7 Remove screws, and detach the LCD unit. ネジ Fig. 4.10.7(d) Replacing the 10.4” LCD backlight (4) - 274 -
- Page 303B-63945EN/02 4.STAND-ALONE TYPE 30i SERIES HARDWARE 8 As shown below, unlock and pull out the case that contains the backlight, and then replace the backlight. The lock is here. CP1 Lift this portion gently, and pull out the backlight. (For details, see the figure below.) LCD Rear view Lock Lift thi
- Page 3044.STAND-ALONE TYPE 30i SERIES HARDWARE B-63945EN/02 4.10.8 Replacing the Touch Panel Protective Sheet If the PANEL i is provided with a touch panel, the touch panel surface is covered with protective sheet. If the protective sheet is scratched or dirty to make the screen less visible, replace it wit
- Page 305B-63945EN/02 4.STAND-ALONE TYPE 30i SERIES HARDWARE 4 As shown in the figure at the lower right, remove the backing film from the new protective sheet surface that is to face the LCD panel. Tab Protective sheet Surface LCD unit side 5 Paste the protective sheet with its tab at the upper right while
- Page 3064.STAND-ALONE TYPE 30i SERIES HARDWARE B-63945EN/02 4.11 REPLACING is SERIES CNC DISPLAY UNIT MAITENANCE PARTS 4.11.1 REPLACING THE MAIN BOARD WARNING Only those personnel who have received approved safety and maintenance training may perform this replacement work. When opening the cabinet and repla
- Page 307B-63945EN/02 4.STAND-ALONE TYPE 30i SERIES HARDWARE 3 Detach the cables from the connectors CA88A (PCMCIA interface connector), CD46L (USB interface connector), and CK20A and CK21A (connectors for soft keys) on the main board. When the 10.4" LCD is used, remove CA79A (video signal interface connecto
- Page 3084.STAND-ALONE TYPE 30i SERIES HARDWARE B-63945EN/02 4.12 Replacing the Fuse WARNING Before starting the replacement of a fuse, remove the cause of the fuse burn-out. Accordingly, the replacement should be performed by a person fully trained in maintenance and safety. If the cabinet is opened to repl
- Page 309B-63945EN/02 4.STAND-ALONE TYPE 30i SERIES HARDWARE 4.12.2 Replacing Fan Motor WARNING When opening the cabinet and replacing a fan motor, be careful not to touch the high-voltage circuits (marked and fitted with an insulating cover). Touching the uncovered high-voltage circuits presents an extremel
- Page 3105.MATTERS COMMON TO BOTH LCD-MOUNTED TYPE AND STAND-ALONE TYPE (HARDWARE) B-63945EN/02 5 MATTERS COMMON TO BOTH LCD-MOUNTED TYPE AND STAND-ALONE TYPE (HARDWARE) This chapter describes printed-circuit boards and units common to LCD-mounted and stand-alone types. It also explains conditions for instal
- Page 311B-63945EN/02 5.MATTERS COMMON TO BOTH LCD-MOUNTED TYPE AND STAND-ALONE TYPE (HARDWARE) 5.1 OPTIONAL BOARD 5.1.1 Fast Data Server - Specification Item Ordering code Fast data server A20B-8101-0030 - Connector mounting location JG2 S-BUS back-plane connector CNH6 CD38R Connector number Use CNH6 ATA ca
- Page 3125.MATTERS COMMON TO BOTH LCD-MOUNTED TYPE AND STAND-ALONE TYPE (HARDWARE) B-63945EN/02 - LED indications The board incorporates the following LEDs: Four green STATUS LEDs and one red ALARM LED for indicating the status. Three green LEDs and one red LED for indicating the communication status. The fi
- Page 313B-63945EN/02 5.MATTERS COMMON TO BOTH LCD-MOUNTED TYPE AND STAND-ALONE TYPE (HARDWARE) LED lighting sequence at power on No. LED indication 1234 Board state 1 STATUS Power off 2 STATUS Initial state after power on 3 STATUS MPU initialized. 4 STATUS Firmware downloaded. 5 STATUS Control migration to
- Page 3145.MATTERS COMMON TO BOTH LCD-MOUNTED TYPE AND STAND-ALONE TYPE (HARDWARE) B-63945EN/02 LED indications related to communication status STATUS LED No. Board state indication 1 COM Lights when data is sent. Lights when the Fast Ethernet/Fast data server is 2 LIL successfully connected to the hub. 3 CO
- Page 315B-63945EN/02 5.MATTERS COMMON TO BOTH LCD-MOUNTED TYPE AND STAND-ALONE TYPE (HARDWARE) 5.1.2 Additional Axis Board - Specification Item Ordering code Additional axis board A20B-8101-0070 - Connector mounting location JGP JD1A COP10A CA69A Connector number Use COP10A FSSB JD1A I/O LINK CA69A Servo ch
- Page 3165.MATTERS COMMON TO BOTH LCD-MOUNTED TYPE AND STAND-ALONE TYPE (HARDWARE) B-63945EN/02 - LED display JGP JD1A COP10A CA69A FSSB_OP LED name Meaning FBBS_OP ON: FSSB connected (FSSB OPEN) - 288 -
- Page 317B-63945EN/02 5.MATTERS COMMON TO BOTH LCD-MOUNTED TYPE AND STAND-ALONE TYPE (HARDWARE) 5.1.3 Additional Spindle Board - Specification Item Ordering code Additional spindle board A20B-8002-0320 - Connector mounting location JGP JA41L Connector number Use JA41L Serial spindle and position coder - Bloc
- Page 3185.MATTERS COMMON TO BOTH LCD-MOUNTED TYPE AND STAND-ALONE TYPE (HARDWARE) B-63945EN/02 5.1.4 HSSB Interface Board - Specification Item Function Ordering code HSSB interface board HSSB × 1 channel A20B-8101-0111 - Connector mounting location JGP COP21N Connector number Use COP21N High-speed serial bu
- Page 319B-63945EN/02 5.MATTERS COMMON TO BOTH LCD-MOUNTED TYPE AND STAND-ALONE TYPE (HARDWARE) - LED display LEDR (red) BRDYA (green) LED name Meaning LEDR Lights to indicate a common RAM parity alarm condition in the LSC. BRDYA Lights to indicate that a link has been established. - 291 -
- Page 3205.MATTERS COMMON TO BOTH LCD-MOUNTED TYPE AND STAND-ALONE TYPE (HARDWARE) B-63945EN/02 5.1.5 FL-net Board - Specification Item Ordering code FL-net board A20B-8101-0031 - Connector mounting location LSI MPU CD38N - 292 -
- Page 321B-63945EN/02 5.MATTERS COMMON TO BOTH LCD-MOUNTED TYPE AND STAND-ALONE TYPE (HARDWARE) - LED indications The board incorporates the following LEDs: Four green STATUS LEDs and one red ALARM LED for indicating the status. Three green LEDs and one red LED for indicating the communication status. The fi
- Page 3225.MATTERS COMMON TO BOTH LCD-MOUNTED TYPE AND STAND-ALONE TYPE (HARDWARE) B-63945EN/02 STATUS LED indications if an error occurs If an error occurs, the LEDs repeatedly flash "LONG" then "SHORT." (For "LONG," the LED lights for a long time. For "SHORT," the LED lights for a short time.) STATUS LED i
- Page 323B-63945EN/02 5.MATTERS COMMON TO BOTH LCD-MOUNTED TYPE AND STAND-ALONE TYPE (HARDWARE) NOTE LIL: Communication is not performed while this LED is not lit. A probable reason for this is that the Fast Ethernet/Fast data server is not properly connected to the hub, or that the hub is off. This LED shou
- Page 3245.MATTERS COMMON TO BOTH LCD-MOUNTED TYPE AND STAND-ALONE TYPE (HARDWARE) B-63945EN/02 5.1.6 PROFIBUS Board - Specification Item Ordering code Remarks PROFIBUS Master board A20B-8101-0050 Master function only PROFIBUS Slave board A20B-8101-0100 Slave function only - Connector mounting location [PROF
- Page 325B-63945EN/02 5.MATTERS COMMON TO BOTH LCD-MOUNTED TYPE AND STAND-ALONE TYPE (HARDWARE) - LED indicators and their meanings [LED indicators for DP-Master function] CN1 LED2 LED1 NOTE The face plate is indicated by the broken line. LED Color Description name Indicates that the CPU on this board has st
- Page 3265.MATTERS COMMON TO BOTH LCD-MOUNTED TYPE AND STAND-ALONE TYPE (HARDWARE) B-63945EN/02 [LED indicators for DP-Slave function] CN2 LEDB LED3 LED2 LED1 NOTE The face plate is indicated by the broken line. LED Color Description name Indicates that the CPU on this board has started running. LED1 Green O
- Page 327B-63945EN/02 5.MATTERS COMMON TO BOTH LCD-MOUNTED TYPE AND STAND-ALONE TYPE (HARDWARE) 5.1.7 DeviceNet Master Board - Specification Item Ordering code DeviceNet master board A20B-8101-0220 - Connector mounting location LSI Daughter board TBL Connector number Use TBL Outside-line connector - 299 -
- Page 3285.MATTERS COMMON TO BOTH LCD-MOUNTED TYPE AND STAND-ALONE TYPE (HARDWARE) B-63945EN/02 - LED indications Detailed view of LEDs Daughter board NS MS (LED) TBL LED3 LED2 LED1 LEDWD LED0 This board provides four green LEDs (STATUS) and one red LED (ALARM) for status indication. In addition, the interna
- Page 329B-63945EN/02 5.MATTERS COMMON TO BOTH LCD-MOUNTED TYPE AND STAND-ALONE TYPE (HARDWARE) In the following explanations, the LED lighting states are expressed as follows: : Off : On : Blinking ◊: Don't care LED display transition for LED0, LED1, LED2, and LED3 (during power-on) LED State and cause w
- Page 3305.MATTERS COMMON TO BOTH LCD-MOUNTED TYPE AND STAND-ALONE TYPE (HARDWARE) B-63945EN/02 LED indication of MS and NS (during normal operation) LED Status Description indication MS Immediately after The MPU on the daughter board is NS power-on being reset. MS Green Initializing The firmware on th
- Page 331B-63945EN/02 5.MATTERS COMMON TO BOTH LCD-MOUNTED TYPE AND STAND-ALONE TYPE (HARDWARE) LED Status Error and action indication MS ◊ Slave not No slaves are present. NS Red present Verify the following: The slave is turned on. The communication rates of all nodes are set to the same value. The cable
- Page 3325.MATTERS COMMON TO BOTH LCD-MOUNTED TYPE AND STAND-ALONE TYPE (HARDWARE) B-63945EN/02 5.2 INSERTING AND EXTRACTING OPTION PCB 5.2.1 Method of Extraction <1> Detach the cable connected to the option board and the cable that interferes when the option board is extracted. <2> Pinch handles A and B for
- Page 333B-63945EN/02 5.MATTERS COMMON TO BOTH LCD-MOUNTED TYPE AND STAND-ALONE TYPE (HARDWARE) A B For stand-alone type control unit - 305 -
- Page 3345.MATTERS COMMON TO BOTH LCD-MOUNTED TYPE AND STAND-ALONE TYPE (HARDWARE) B-63945EN/02 5.3 MOUNTING AND DEMOUNTING CARD PCBS WARNING Only those personnel who have received approved safety and maintenance training may perform this replacement work. When opening the cabinet and replacing a card PCB, b
- Page 335B-63945EN/02 5.MATTERS COMMON TO BOTH LCD-MOUNTED TYPE AND STAND-ALONE TYPE (HARDWARE) 5.3.1 Method of Extraction <1> Pull up the spacer metal fitting. <2> A molded cover is attached to a corner of the servo card and CPU card although the shapes of the covers attached to the cards differ from each o
- Page 3365.MATTERS COMMON TO BOTH LCD-MOUNTED TYPE AND STAND-ALONE TYPE (HARDWARE) B-63945EN/02 For extraction, insert a finger into the rear of this cover, then pull up the cover in the arrow direction. Push back the cover softly. Please put a finger in the reverse of this part and pull up this part when re
- Page 337B-63945EN/02 5.MATTERS COMMON TO BOTH LCD-MOUNTED TYPE AND STAND-ALONE TYPE (HARDWARE) 5.3.2 Method of Insertion <1> Check that the metal fittings of the spacers are raised. <2> To align the card board insertion position, touch the spacer fixing end faces of the card board with the spacers as shown
- Page 3385.MATTERS COMMON TO BOTH LCD-MOUNTED TYPE AND STAND-ALONE TYPE (HARDWARE) B-63945EN/02 5.4 MOUNTING AND DEMOUNTING DIMM MODULES WARNING Only those personnel who have received approved safety and maintenance training may perform this replacement work. When opening the cabinet and replacing a module,
- Page 339B-63945EN/02 5.MATTERS COMMON TO BOTH LCD-MOUNTED TYPE AND STAND-ALONE TYPE (HARDWARE) 5.4.1 Demounting a DIMM Module (1) Open the claw of the socket outward. (See Fig. a.) (2) Extract the module slantly upward. (See Fig. b.) 5.4.2 Mounting a DIMM Module (1) Insert the module slantly into the module
- Page 3405.MATTERS COMMON TO BOTH LCD-MOUNTED TYPE AND STAND-ALONE TYPE (HARDWARE) B-63945EN/02 5.5 INSERTING AND EXTRACTING A COMPACT FLASH / GUI CARD ON THE DISPLAY CONTROL CARD WARNING Only those personnel who have received approved safety and maintenance training may perform this replacement work. When o
- Page 341B-63945EN/02 5.MATTERS COMMON TO BOTH LCD-MOUNTED TYPE AND STAND-ALONE TYPE (HARDWARE) 5.5.1 Method of Extraction <1> Face side B of the display control / GUI card upward, then pull up the retainer of the socket. <2> Turn the latch toward the far side, then extract the compact flash card. 5.5.2 Meth
- Page 3425.MATTERS COMMON TO BOTH LCD-MOUNTED TYPE AND STAND-ALONE TYPE (HARDWARE) B-63945EN/02 5.6 OTHER UNITS 5.6.1 Separate Detector Interface Unit - Specification Name Specification Basic unit A02B-0303-C205 Additional unit A02B-0236-C204 - Connector mounting location CNF1 (CNF2) JF101(JF105) JF102(JF106
- Page 343B-63945EN/02 5.MATTERS COMMON TO BOTH LCD-MOUNTED TYPE AND STAND-ALONE TYPE (HARDWARE) - LED display Status indication LEDs are installed on the board in the basic unit case. Two green LEDs (POWER and OPEN) and two red LEDs (ERR1 and ERR2) are provided. The locations and meanings of the LEDs are ind
- Page 3445.MATTERS COMMON TO BOTH LCD-MOUNTED TYPE AND STAND-ALONE TYPE (HARDWARE) B-63945EN/02 5.6.2 Analog Input Separate Detector Interface Unit - Specification Name Specification Basic unit A06B-6061-C201 No dedicated additional unit is available for the analog input separate detector interface unit. The
- Page 345B-63945EN/02 5.MATTERS COMMON TO BOTH LCD-MOUNTED TYPE AND STAND-ALONE TYPE (HARDWARE) - LED display Status indication LEDs are installed on the board in the basic unit case. Two green LEDs (POWER and OPEN) and two red LEDs (ERR1 and ERR2) are provided. The locations and meanings of the LEDs are ind
- Page 3465.MATTERS COMMON TO BOTH LCD-MOUNTED TYPE AND STAND-ALONE TYPE (HARDWARE) B-63945EN/02 5.7 LIQUID CRYSTAL DISPLAY (LCD) LCD with a touch panel The touch panel is operated by directly touching the LCD screen. For this operation, be sure to use a FANUC-supplied pen (A02B-0236-K111) dedicated to the to
- Page 347B-63945EN/02 5.MATTERS COMMON TO BOTH LCD-MOUNTED TYPE AND STAND-ALONE TYPE (HARDWARE) Fold <2> Peel off the backing sheet. <3> Position the sheet, then attach the upper and lower sides of the sheet first. Check that the sides of the protection sheet do not touch the escutcheon. OK NG <4> Attach the
- Page 3485.MATTERS COMMON TO BOTH LCD-MOUNTED TYPE AND STAND-ALONE TYPE (HARDWARE) B-63945EN/02 - Parameter #7 #6 #5 #4 #3 #2 #1 #0 3113 DCL [Input type] Parameter input [Data type] Bit #5 DCL The touch panel compensation screen is: 0: Disabled. 1: Enabled. Set this parameter to 0 usually. Touch panel compen
- Page 349B-63945EN/02 5.MATTERS COMMON TO BOTH LCD-MOUNTED TYPE AND STAND-ALONE TYPE (HARDWARE) <4> Press the [TOUCH PANEL] soft key then the [(OPRT)] soft key. The [TP CAL] soft key is displayed. <5> Pressing the [TP CAL] soft key causes a full-screen touch panel calibration screen to appear. <6> Click the
- Page 3505.MATTERS COMMON TO BOTH LCD-MOUNTED TYPE AND STAND-ALONE TYPE (HARDWARE) B-63945EN/02 <8> When calibration ends normally, the message “Calibration ended” appears. <9> After completing calibration, disable the touch panel calibration screen (by resetting the DCL parameter (bit 5 of parameter No. 311
- Page 351B-63945EN/02 5.MATTERS COMMON TO BOTH LCD-MOUNTED TYPE AND STAND-ALONE TYPE (HARDWARE) 5.8 DISTRIBUTED I/O SETTING By changing the setting (rotary switch) on an expansion module, a connection can be made to skip an expansion module or expansion modules as shown below. Expansion module 1 Expansion mo
- Page 3525.MATTERS COMMON TO BOTH LCD-MOUNTED TYPE AND STAND-ALONE TYPE (HARDWARE) B-63945EN/02 Each setting position of the rotary switch has the meaning as indicated below. Setting Indication Meaning of setting position Standard setting. The rotary switch is set to this position at 0 0 the time of shipment
- Page 353B-63945EN/02 5.MATTERS COMMON TO BOTH LCD-MOUNTED TYPE AND STAND-ALONE TYPE (HARDWARE) This function was not available initially, but was recently added. This function became available, depending on the type of module, as indicated below. Expansion module B (DI/DO = 24/16, A03B-0815-C003 Available s
- Page 3545.MATTERS COMMON TO BOTH LCD-MOUNTED TYPE AND STAND-ALONE TYPE (HARDWARE) B-63945EN/02 5.9 REPLACING FUSES ON VARIOUS UNITS WARNING Before replacement of a blown fuse, the cause of the blown fuse must be corrected. So, fuse replacement work must be done only by a person who is trained in the related
- Page 355B-63945EN/02 5.MATTERS COMMON TO BOTH LCD-MOUNTED TYPE AND STAND-ALONE TYPE (HARDWARE) - Fuse mounting location on the connector panel I/O modules Fuse Expansion module 3 Expansion module 2 Expansion module 1 Basic module Cable for the I/O Link (A03B-0815-C001) Cable for a manual pulse generator NOT
- Page 3565.MATTERS COMMON TO BOTH LCD-MOUNTED TYPE AND STAND-ALONE TYPE (HARDWARE) B-63945EN/02 - Fuse mounting location on the operator's panel I/O modules I/O connector JD1A JD1B JA3 Fuse Power supply connector This drawing is for A20B-2002-0470, A20B-2002-0520, and A20B-2002- 0521. - Fuse mounting locatio
- Page 357B-63945EN/02 5.MATTERS COMMON TO BOTH LCD-MOUNTED TYPE AND STAND-ALONE TYPE (HARDWARE) 5.10 ENVIRONMENTAL CONDITIONS OUTSIDE CABINET The control units and various peripheral units supplied from FANUC are designed assuming that those units are accommodated in enclosed cabinets. The cabinets mentioned
- Page 3585.MATTERS COMMON TO BOTH LCD-MOUNTED TYPE AND STAND-ALONE TYPE (HARDWARE) B-63945EN/02 NOTE When the CNC is installed at a height of more than 1000 m above the sear level, a restriction is imposed on the maximum allowable ambient temperature for the CNC inside the cabinet. For every 100 m rise from
- Page 359B-63945EN/02 5.MATTERS COMMON TO BOTH LCD-MOUNTED TYPE AND STAND-ALONE TYPE (HARDWARE) 5.11 COUNTERMEASURES AGAINST NOISE The CNC is becoming increasingly smaller as the surface mount technology and custom LSI technology advance. In many cases, as the CNC becomes more compact, the mounting locations
- Page 3605.MATTERS COMMON TO BOTH LCD-MOUNTED TYPE AND STAND-ALONE TYPE (HARDWARE) B-63945EN/02 NOTE 1 Separate binding is to separate the bound cables of one group at least 10 cm from the bound cables of another group. 2 Electromagnetic shielding is to shield the bound cables of one group from the bound cab
- Page 361B-63945EN/02 5.MATTERS COMMON TO BOTH LCD-MOUNTED TYPE AND STAND-ALONE TYPE (HARDWARE) 5.11.2 Grounding With a CNC machine tool, three ground systems are used. • Signal ground system (SG) Signal ground (SG) provides a reference voltage (0 V) for the electric signal system. • Frame ground system (FG)
- Page 3625.MATTERS COMMON TO BOTH LCD-MOUNTED TYPE AND STAND-ALONE TYPE (HARDWARE) B-63945EN/02 (2) Method of grounding to a near plate Units Connection line A PE Connection line B Connection line for grounding Connection line for protective earth (PE) Notes on ground system wiring • The grounding resistance
- Page 363B-63945EN/02 5.MATTERS COMMON TO BOTH LCD-MOUNTED TYPE AND STAND-ALONE TYPE (HARDWARE) Guideline for selecting a cross-sectional area of protective copper wire Rated current of the fuse for protecting a Cross-sectional area circuit, or rated current of the overcurrent of protective copper protective
- Page 3645.MATTERS COMMON TO BOTH LCD-MOUNTED TYPE AND STAND-ALONE TYPE (HARDWARE) B-63945EN/02 5.11.3 Signal Ground (SG) Connection of Control Unit Connecting the 0 V output in the CNC to a protective circuit (ground) The IEC 204-1 and JIS B 6015 standards specify the following: - Protection against malfunc
- Page 365B-63945EN/02 5.MATTERS COMMON TO BOTH LCD-MOUNTED TYPE AND STAND-ALONE TYPE (HARDWARE) Connecting the ground terminal of an LCD-mounted type control unit Connect the 0-V line in the control unit with the ground plate of the cabinet or a nearby plate via the protective grounding terminal (see above f
- Page 3665.MATTERS COMMON TO BOTH LCD-MOUNTED TYPE AND STAND-ALONE TYPE (HARDWARE) B-63945EN/02 Connecting the ground terminal of a stand-alone type control unit For 2-slot rack For 4-slot rack Signal ground terminal (Faston terminal) Ground cable 2 2 mm or more Grounding plate of the cabinet PE Connect the
- Page 367B-63945EN/02 5.MATTERS COMMON TO BOTH LCD-MOUNTED TYPE AND STAND-ALONE TYPE (HARDWARE) 5.11.4 Noise Suppressor With a power magnetics cabinet, components such as an AC/DC solenoid and AC/DC relay are used. When turned on and off, these components generate a high-energy pulse voltage due to coil indu
- Page 3685.MATTERS COMMON TO BOTH LCD-MOUNTED TYPE AND STAND-ALONE TYPE (HARDWARE) B-63945EN/02 5.11.5 Cable Clamping and Shielding According to the figure below, clamp all cables that require shielding and are run to the CNC, servo amplifier, spindle amplifier, and so forth. This clamping method not only se
- Page 369B-63945EN/02 5.MATTERS COMMON TO BOTH LCD-MOUNTED TYPE AND STAND-ALONE TYPE (HARDWARE) Mounting plate of the machine Control unit Ground plate Clamp Shield cover Fig. 5.11.5 (b) Cable clamp (2) NOTE Bring together the cables connected to a CNC or amplifier near the unit and shield them. Prepare a gr
- Page 3705.MATTERS COMMON TO BOTH LCD-MOUNTED TYPE AND STAND-ALONE TYPE (HARDWARE) B-63945EN/02 Ground plate 8 12 20 Fig. 5.11.5 (d) Ground plate hole diagram Reference: Outline drawing of the clamp Up to 55 28 6 17 Fig. 5.11.5 (e) Outline drawing of clamp Ordering code of the clamp: A02B-0124-K001 (set of 8
- Page 371B-63945EN/02 5.MATTERS COMMON TO BOTH LCD-MOUNTED TYPE AND STAND-ALONE TYPE (HARDWARE) 5.12 BATTERY FOR ABSOLUTE PLUSE CODERS (1) When the voltage of the battery for absolute Pulsecoders becomes low, DS alarms 306 to 308 occur. (2) When DS alarm 307 (alarm indicating the voltage of the battery becom
- Page 3725.MATTERS COMMON TO BOTH LCD-MOUNTED TYPE AND STAND-ALONE TYPE (HARDWARE) B-63945EN/02 NOTE The absolute Pulsecoder of the αi/αis/βis (β0.4is to β22is) series servo motor is incorporated with a backup capacitor as standard. This backup capacitor enables an absolute position detection to be continued
- Page 373B-63945EN/02 5.MATTERS COMMON TO BOTH LCD-MOUNTED TYPE AND STAND-ALONE TYPE (HARDWARE) - Replacing D-size alkaline dry cells in the battery case Replace four D-size alkaline batteries (A06B-6050-K061) in the battery case installed in the machine. <1> Have four D-size alkaline batteries on hand. <2>
- Page 3745.MATTERS COMMON TO BOTH LCD-MOUNTED TYPE AND STAND-ALONE TYPE (HARDWARE) B-63945EN/02 - Attaching the built-in battery (αi series servo amplifier) Attach the lithium battery (A06B-6073-K001) to the servo amplifier. [Attachment procedure] (1) Remove a battery cover from the servo amplifier. (2) Atta
- Page 375B-63945EN/02 5.MATTERS COMMON TO BOTH LCD-MOUNTED TYPE AND STAND-ALONE TYPE (HARDWARE) Battery Battery cover SVU-12, SVU-20 Battery Battery cover Pass the battery cable to this slit. SVU-40, SVU-80 CAUTION 1 The connector of the battery can be connected with either of CX5X and CX5Y. 2 Attaching the
- Page 3765.MATTERS COMMON TO BOTH LCD-MOUNTED TYPE AND STAND-ALONE TYPE (HARDWARE) B-63945EN/02 - Used batteries Old batteries should be disposed as "INDUSTRIAL WASTES" according to the regulations of the country or autonomy where your machine has been installed. - 348 -
- Page 377B-63945EN/02 5.MATTERS COMMON TO BOTH LCD-MOUNTED TYPE AND STAND-ALONE TYPE (HARDWARE) 5.13 ATTACHING AND DETACHING LCD/MDI UNITS The 30i series LCD units (except the 15” LCD type) and MDI units are fastened with screws from the front surface. The screws are covered with screw caps. 5.13.1 Detaching
- Page 3785.MATTERS COMMON TO BOTH LCD-MOUNTED TYPE AND STAND-ALONE TYPE (HARDWARE) B-63945EN/02 5.13.2 Attaching A B B A A B Only the type-A screw cap has a boss (for discrimination purposes). <1> Fasten the four corners with screws. <2> There are two types of screw caps. Attach each type as shown above. Pus
- Page 379B-63945EN/02 6.INPUT AND OUTPUT OF DATA 6 INPUT AND OUTPUT OF DATA After you change a SRAM module, you must set various data again. This chapter describes the procedures to input and output the parameters, the part programs and the tool offset values. 6.1 SETTING PARAMETERS FOR INPUT/OUTPUT ........
- Page 3806.INPUT AND OUTPUT OF DATA B-63945EN/02 6.1 SETTING PARAMETERS FOR INPUT/OUTPUT Setting procedure of parameters Parameter writing is enabled with following steps 1 to 3. 1 Set to MDI mode or emergency stop state. 2 Press key several times or press soft key [SETING] to OFFSET SETTING display SETTING
- Page 381B-63945EN/02 6.INPUT AND OUTPUT OF DATA 7 Convenient method <1> To change parameters in bit unit, press cursor key or , then the cursor becomes bit length and you can set parameters bit by bit (Bit parameter only). <2> To set data consecutively, use EOB key. (Ex.1) 1 2 3 4 EOB 4 5 6 7 EOB 9 9 9 9 IN
- Page 3826.INPUT AND OUTPUT OF DATA B-63945EN/02 6.2 INPUTTING/ OUTPUTTING DATA The main CPU memorized the following data. Outputting the data 1/O device while the CNC is rurnning normally. (1) CNC paramter (2) PMC parameter (3) Pitch error compensation amount (4) Custom macro variable values (5) Tool compen
- Page 383B-63945EN/02 6.INPUT AND OUTPUT OF DATA 0102 Pecification number of input/output device Set value Input/output device 0 RS-232-C (Used control codes DC1 to DC4) 1 FANUC CASSETTE ADAPTOR 1 (FANUC CASSETTE B1/B2) 2 FANUC CASSETTE ADAPTOR 3 (FANUC CASSETTE F1) FANUC PROGRAM FILE Mate, FANUC FA Card Ada
- Page 3846.INPUT AND OUTPUT OF DATA B-63945EN/02 6.2.3 Outputting Pitch Error Compensation Amount 1 Select EDIT mode. 2 Press the function key SYSTEM and several times, then press [PITCH] to select the pitch error compensation setting screen. 3 Press soft key [(OPRT)] and . 4 Press soft key [PUNCH] and [EXEC
- Page 385B-63945EN/02 6.INPUT AND OUTPUT OF DATA 6.2.6 Outputting Part Program 1 Confirm the following parameters. If this parameter is set to 1, rather than the value indicated by l, change to MDI mode and then reset to 0. However, if you changed the parameter setting, restore the original value after finis
- Page 3866.INPUT AND OUTPUT OF DATA B-63945EN/02 <5> #7 #6 #5 #4 #3 #2 #1 #0 0101 NFD ASI SB2 NFD 0: Feed is output when punching out. 1: Feed is not output when punching out. ASI 0: EIA or ISO code is used. 1: ASCII code is used. SB2 0: No. of stop bits is 1. (*)1: No. of stop bits is 2. <6> 0102 Specificat
- Page 387B-63945EN/02 6.INPUT AND OUTPUT OF DATA 6.2.8 Inputting Pitch Error Compensation Amount 1 Release the emergency stop and select EDIT mode. 2 Confirm that PARAMETER WRITE=1 on the setting screen. 3 Press PROG key and soft key [PRGRM] to display program contents. 4 Press SYSTEM key several times, soft
- Page 3886.INPUT AND OUTPUT OF DATA B-63945EN/02 6.2.11 Inputting Part Programs Confirm the following parameters. If the setting is different from the value indicated by (*), reset to the specified value only during this work. (Change it in MDI mode). #7 #6 #5 #4 #3 #2 #1 #0 3201 NPE RAL NPE When programs ar
- Page 389B-63945EN/02 7.INTERFACE BETWEEN CNC AND PMC 7 INTERFACE BETWEEN CNC AND PMC 7.1 WHAT IS PMC? ......................................................................362 7.2 MULTI-PMC FUNCTION.......................................................366 7.3 PMC SPECIFICATIONS ............................
- Page 3907.INTERFACE BETWEEN CNC AND PMC B-63945EN/02 7.1 WHAT IS PMC? The programmable machine controller (PMC) is a programmable controller (PC) built into a CNC to perform sequence control for a machine tool (spindle rotation, tool change, machine operator's panel control, and so on). Sequence control is
- Page 391B-63945EN/02 7.INTERFACE BETWEEN CNC AND PMC 7.1.3 PMC Signal Addresses PMC signal addresses indicate the locations of I/O signals exchanged with the machine, I/O signals exchanged with the CNC, and signals for internal relays and data (PMC parameters) in nonvolatile memory. PMC addresses are roughl
- Page 3927.INTERFACE BETWEEN CNC AND PMC B-63945EN/02 Table 7.1.3 lists the address symbols and corresponding signals. Table 7.1.3 Address Symbols and signal types Symbol Signal type F Input signal from CNC to PMC (CNC → PMC) G Output signal from PMC to CNC (PMC → CNC) X Input signal from machine to PMC (MT
- Page 393B-63945EN/02 7.INTERFACE BETWEEN CNC AND PMC (5) Nonvolatile memory addresses The contents of these address locations are not erased even when the power is turned off. These addresses are used for management of the data items listed below. These data items are called PMC parameters. (a) Variable tim
- Page 3947.INTERFACE BETWEEN CNC AND PMC B-63945EN/02 7.2 MULTI-PMC FUNCTION The multi-PMC function allows one PMC system to execute multiple sequence programs at the same time. PMC memory for each sequence program is basically independent, and the same PMC address can be used for different purposes of the i
- Page 395B-63945EN/02 7.INTERFACE BETWEEN CNC AND PMC Fig. 7.2 (b) shows a configuration example. CNC PMC Machine 1st PMC Operator's control group panel for machine control, etc. (1) Peripheral 2nd PMC equipment, etc. Loader 3rd PMC Operator's control group panel for loader, etc. Fig. 7.2 (b) Multi-PMC funct
- Page 3967.INTERFACE BETWEEN CNC AND PMC B-63945EN/02 7.2.1 Execution Order and Execution Time Percentage For the multi-PMC function, the order of PMC execution and execution time percentages of the PMCs can be set with CNC parameters. Execution order If parameters related to the execution order are not set
- Page 397B-63945EN/02 7.INTERFACE BETWEEN CNC AND PMC An example of changing the execution order and execution time percentages by setting CNC parameters is explained below. In the following, sequence programs are executed in the order from the third PMC to the first PMC to the second PMC with the execution
- Page 3987.INTERFACE BETWEEN CNC AND PMC B-63945EN/02 7.2.2 Setting I/O Address for I/O Link The I/O addresses of I/O Link channels can be assigned with CNC parameters. If these parameters are not set (0 is set), all channels are assigned to the first PMC by default as follows: 1st PMC Channel 1 X/Y0 to X/Y1
- Page 399B-63945EN/02 7.INTERFACE BETWEEN CNC AND PMC 7.2.3 Interface Between CNC and PMC The PMC to control the interface between the CNC and PMC and PMC addresses (F/G addresses) can be set with CNC parameters. With these parameter settings, a desired interface control system can be built, in which the ent
- Page 4007.INTERFACE BETWEEN CNC AND PMC B-63945EN/02 In the following example, F/G0 to F/G767 and F/G1000 to F/G1767 of the CNC are assigned to F/G0 to F/G767 and F/G1000 to F/G1767 of the first PMC, and F/G3000 to F/G3767 of the CNC are assigned to F/G0 to F/G767 of the second PMC: CNC 1st PMC F/G0 to F/G7
- Page 401B-63945EN/02 7.INTERFACE BETWEEN CNC AND PMC 7.2.4 Multi-Path PMC Interface The multi-path PMC interface is the communication means between two PMC paths. Generally, Each path of multi-path PMC system has individual PMC memory space except E address. And, E address can be used to share data of multi
- Page 4027.INTERFACE BETWEEN CNC AND PMC B-63945EN/02 7.2.5 Internal Relay (System Area) Addresses (R) Internal addresses (R) 9000s are an area managed by the system program. Operation results of functional instructions This area holds information necessary for individual ladder levels, such as the operation
- Page 403B-63945EN/02 7.INTERFACE BETWEEN CNC AND PMC System timers Four signals can be used as system timers. Their specifications are as follows. 7 6 5 4 3 2 1 0 R9091 Normally OFF signal Normally ON signal 200 ms cyclic signal (104 ms ON and 96 ms OFF) 1 s cyclic signal (504 ms ON and 496 m OFF) CAUTION 1
- Page 4047.INTERFACE BETWEEN CNC AND PMC B-63945EN/02 Ladder execution start signal Ladder stop signal Ladder execution status signal Using the ladder execution start and stop signals in a ladder program can detect when the ladder program starts and stops. Referencing the ladder execution status signal from
- Page 405B-63945EN/02 7.INTERFACE BETWEEN CNC AND PMC (1) Ladder execution start signal (R9015.0) When directed to start ladder program execution, the system software starts executing the ladder program, turns on this signal, and keeps it on for the first one scan cycle. Like R9000, this signal indicates the
- Page 4067.INTERFACE BETWEEN CNC AND PMC B-63945EN/02 CAUTION 1 Reference this signal only within the ladder program. Do not reference it from an external system or program as it indicates the status of ladder execution separately for each ladder execution level. 2 If the power is turned off or a CNC system
- Page 407B-63945EN/02 7.INTERFACE BETWEEN CNC AND PMC (b) Example of forcibly turning off an output signal programmed on the first ladder level just before the ladder stops Input Output (c) Example of sending an execution-in-progress signal to the outside Outputting the status of this signal as the DO signal
- Page 4087.INTERFACE BETWEEN CNC AND PMC B-63945EN/02 7.3 PMC SPECIFICATIONS 7.3.1 Basic Specifications Table 7.3.1 (a) Basic specifications of the PMCs for the Series 30i/31i/32i-A 30i/31i/32i-A Function Second PMC Third PMC First PMC DCS PMC (Note 1) (option) (option) Programming language Ladder Ladder Lad
- Page 409B-63945EN/02 7.INTERFACE BETWEEN CNC AND PMC Table 7.3.1 (b) Basic specifications of the PMCs for the Series 30i/31i/32i-A 30i/31i/32i-A Function First PMC Second PMC Third PMC Dual-check safety (option) (option) PMC (Note 1) PMC memory • Subprograms (P) 5,000 pieces 512 pieces 512 pieces 512 pieces
- Page 4107.INTERFACE BETWEEN CNC AND PMC B-63945EN/02 NOTE 8 Series 30i can use up to four I/O Link channels (4,096 input points and 4,096 output points). Series 31i/32i can use up to three I/O Link channels (3,072 input points and 3,072 output points). However, only one I/O Link channel (1,024 input points
- Page 411B-63945EN/02 7.INTERFACE BETWEEN CNC AND PMC 7.3.2 Addresses Table 7.3.2 (a) Addresses of the PMCs for the Series 30i/31i/32i-A 30i/31i/32i-A Dual-check Function Symbol Second PMC Third PMC First PMC safety PMC (option) (option) (option) Signal input to the PMC X X0 to X127 X0 to X127 X0 to X127 X0
- Page 4127.INTERFACE BETWEEN CNC AND PMC B-63945EN/02 Table 7.3.2 (b) Addresses of PMCs for the Series 30i/31i/32i-A 30i/31i/32i-A Dual-check Function Symbol Second PMC Third PMC First PMC safety PMC (option) (option) (option) Message display A • Display request A0 to A249 A0 to A249 A0 to A249 A0 to A249 •
- Page 413B-63945EN/02 7.INTERFACE BETWEEN CNC AND PMC 7.4 OPERATING THE PMC SCREEN The basic configuration of the PMC screen is described below. Screen title Ladder PMC alarm PMC path NC program number execution status NC status indication [+] Soft key page turning key Key entry line Message display line Ret
- Page 4147.INTERFACE BETWEEN CNC AND PMC B-63945EN/02 • NC status indication: Displays the NC mode, the execution status of the NC program, the currently selected NC path number. • Return key: Used to switch from the PMC operation menu to a specific PMC submenu or from a specific PMC submenu to the main menu
- Page 415B-63945EN/02 7.INTERFACE BETWEEN CNC AND PMC 7.4.1 Transition of the PMC Screens SYSTEM PMC main menu PMC maintenance submenu STATUS Signal status screen (See Section 7.1.) PMC MAINTE I/O LINK I/O link connection status screen (See Section 7.5.) < PMC ALARM PMC alarm screen (See Section 7.2.) I/O Da
- Page 4167.INTERFACE BETWEEN CNC AND PMC B-63945EN/02 7.5 PMC DIAGNOSIS AND MAINTENANCE SCREENS ([PMC MAINTE]) 7.5.1 Monitoring PMC Signal Status ([STATUS] Screen) The SIGNAL STATUS screen displays the data at all addresses specified in the program. The data of each address consists of a bit pattern (0s and/
- Page 417B-63945EN/02 7.INTERFACE BETWEEN CNC AND PMC (3) The data starting at the input address is displayed as a bit pattern. (4) To display the data at another address, press the cursor keys, page keys, or [SEARCH] soft key. (5) To modify the status of a signal, switch to the forced I/O screen by pressing
- Page 4187.INTERFACE BETWEEN CNC AND PMC B-63945EN/02 7.5.2 Checking PMC Alarms ([PMC ALARM] Screen) On this screen, an alarm message output from the PMC is displayed. To move to the PMC alarm screen, press the [PMC ALARM] soft key. Page display Alarm message display area In the alarm message display area, a
- Page 419B-63945EN/02 7.INTERFACE BETWEEN CNC AND PMC 7.5.3 Setting and Displaying Variable Timers ([TIMER] Screen) This screen is used to set and display timer values for functional instruction variable timers (TMR:SUB 3). This screen can be used in one of two modes: the simple display mode and the comment
- Page 4207.INTERFACE BETWEEN CNC AND PMC B-63945EN/02 Table contents • NO.: Timer number specified for a functional instruction timer. • ADDRESS: Address referenced by a sequence program • PRESET: Timer setting value • ACC: Timer accuracy • COMMENT: T address comment In the PRESET column, timer setting value
- Page 421B-63945EN/02 7.INTERFACE BETWEEN CNC AND PMC 7.5.4 Setting and Displaying Counter Values ([COUNTR] Screen) This screen is used to set and display the maximum and minimum counter values for functional instruction counters (CTR: SUB 5). This screen can be used in one of two modes: the simple display m
- Page 4227.INTERFACE BETWEEN CNC AND PMC B-63945EN/02 Table contents • NO.: Counter number specified for a functional instruction counter • ADDRESS: Address referenced by a sequence program • PRESET: Maximum counter value (a minimum counter value is specified by a counter instruction) • CURRENT: Current coun
- Page 423B-63945EN/02 7.INTERFACE BETWEEN CNC AND PMC 7.5.5 Setting and Displaying Keep Relays ([KEEP RELAY] Screen) This screen is used for setting and displaying the Keep Relays. To move to the KEEP RELAY screen, press the [KEEP RELAY] soft key. Page display Key input line Message display line Additional i
- Page 4247.INTERFACE BETWEEN CNC AND PMC B-63945EN/02 7.5.6 Setting and Displaying Data Tables ([DATA] Screen) There are two data table types (data table control data table and data table). To move to the data screen, press the [DATA] soft key. (1) DATA TABLE CONTROL screen ([List] screen) Pressing the [DATA
- Page 425B-63945EN/02 7.INTERFACE BETWEEN CNC AND PMC Table contents • GROUP TABLE COUNT: Number of data items in the data table • NO.: Group number • ADDRESS: Data table start address • PARAMETER: Data table control parameter • TYPE: Data length (0 = 1 byte, 1 = 2 bytes, 2 = 4 bytes, 3 = bit) • DATA: Number
- Page 4267.INTERFACE BETWEEN CNC AND PMC B-63945EN/02 Soft keys on the DATA TABLE CONTROL screen Display mode switching Data table control data initialization Switching to the zoom screen Switching to the soft keys for parameter setting Input of the number Symbol display Switching to the soft keys for data s
- Page 427B-63945EN/02 7.INTERFACE BETWEEN CNC AND PMC (2) DATA TABLE screen ([ZOOM] screen) If the data table control data is specified, clicking the [ZOOM] soft key on the data table control data screen displays the data table setting screen. This screen can be used in one of three modes: the simple display
- Page 4287.INTERFACE BETWEEN CNC AND PMC B-63945EN/02 Bit display mode Table contents • NO. • ADDRESS: Address used by the sequence program • DATA: Data value of data table • COMMENT: Comment on the D address • 0 to 7: Data of each bit • HEX: Display of each byte in hexadecimal The group information line at
- Page 429B-63945EN/02 7.INTERFACE BETWEEN CNC AND PMC 7.5.7 Data Input/Output ([I/O] Screen) To move to the I/O screen, press the [I/O] soft key. On this screen, sequence programs, PMC parameters and PMC message data for multi-language display can be written to the specified device, read from the device, and
- Page 4307.INTERFACE BETWEEN CNC AND PMC B-63945EN/02 The following gives a display example shown when PMC parameters are written to a memory card: Soft keys on the I/O screen Execution Switching to the port setting screen Switching to the list screen Cancellation - 402 -
- Page 431B-63945EN/02 7.INTERFACE BETWEEN CNC AND PMC 7.5.8 Displaying I/O Link Connection Status ([I/O LINK] Screen) I/O LINK MONITOR screen shows the types and the ID codes of I/O Units that are connected to I/O Link in order of Group number. To switch the screen display to the I/O LINK MONITOR screen, pre
- Page 4327.INTERFACE BETWEEN CNC AND PMC B-63945EN/02 Table 7.5 Displayed type and true type of I/O Units Displayed I/O Unit ID True I/O Unit FRC MIF B1 MIF Board for ROBOCUT I/O CARD B2 I/O board ROBOSHOT I/O CARD A B3 I/O for ROBOSHOT LOADER I/O (MATRIX) B4 I/O Board for Loader(Matrix) PROCESS I/O FA B5 Pr
- Page 433B-63945EN/02 7.INTERFACE BETWEEN CNC AND PMC 7.5.9 Signal Trace Function ([TRACE] Screen) SIGNAL TRACE screen (initial screen) Before trace operation can be executed, the trace parameters must be set. Press the [TRACE SETING] soft key to switch the screen display to the trace parameter setting scree
- Page 4347.INTERFACE BETWEEN CNC AND PMC B-63945EN/02 7.5.10 Setting of Trace Parameter ([TRACE SETING] Screen) On the trace parameter setting screen, a sampling condition can be set. The screen consists of two pages. Use the page keys to switch between the pages. Trace parameter setting screen (first page)
- Page 435B-63945EN/02 7.INTERFACE BETWEEN CNC AND PMC (d) SAMPLING/ FRAME This parameter is displayed when "SIGNAL TRANSITION" is set on SAMPLING/ MODE". The number of sampling is inputted. The value of "SAMPLING/ RESOLUTION" or the number of specified signal addresses changes the range of the value that is
- Page 4367.INTERFACE BETWEEN CNC AND PMC B-63945EN/02 (i) SAMPLING CONDITION When "SIGNAL TRANSITION" is set on "TRACE MODE", this parameter is enabled. Determine the sampling condition. • TRIGGER: Samples the status of specified signals when the specified sampling condition is on. • ANY CHANGE: Samples the
- Page 437B-63945EN/02 7.INTERFACE BETWEEN CNC AND PMC In page 2 of the PARAMETER SETTING screen, you can set the addresses or symbols that should be sampled. Trace parameter setting screen (second page) (a) Setting addresses In case of inputting discrete bit addresses, any bit address can be inputted. Moreov
- Page 4387.INTERFACE BETWEEN CNC AND PMC B-63945EN/02 NOTE 1 For the PMC numbers, see Section 7.2. 2 If there is not “:” key in your keyboard, use “;” or “/”. 3 The signals of the PMC for dual check safety cannot be traced. 4 Increasing the number of the signal address changes the capacity of "SAMPLING/ TIME
- Page 439B-63945EN/02 7.INTERFACE BETWEEN CNC AND PMC 7.5.11 Execution of Trace After the trace parameters are set, a trace operation can be started by pressing the [(OPRT)] soft key and the [RUN] soft key on the SIGNAL TRACE screen. The following is the screen examples of the trace execution by "TIME CYCLE"
- Page 4407.INTERFACE BETWEEN CNC AND PMC B-63945EN/02 7.5.11.1 Operation after execution of trace When the execution is finished, the result of trace is displayed. The followings are the screen examples of trace by "TIME CYCLE" and "SIGNAL TRANSITION" mode. Result of trace screen (TIME CYCLE mode) Result of
- Page 441B-63945EN/02 7.INTERFACE BETWEEN CNC AND PMC a) Scroll of screen • Cursor up/down key and Page up/down key Enables the vertical scroll for the specified signal • Cursor right/left key, [NEXT>>] soft key and [<< PREV] soft key Enables the horizontal scroll of the graph. b) Automatic calculation of th
- Page 4427.INTERFACE BETWEEN CNC AND PMC B-63945EN/02 Result of trace screen (Zoom out display) d) Exchange of sampling signal Pushing [MOVE UP] soft key exchanges the signal indicated by the signal cursor for the signal one line above. Pushing [MOVE DOWN] soft key exchanges the signal indicated by the signa
- Page 443B-63945EN/02 7.INTERFACE BETWEEN CNC AND PMC 7.5.12 MONITORING I/O DIAGNOSIS ([I/O DGN] SCREEN) In I/O Diagnosis screen, you can check the status of each I/O variable. You can also check the configuration of I/O devices and the communication status with them. Listing order Additional information GRP
- Page 4447.INTERFACE BETWEEN CNC AND PMC B-63945EN/02 I/O INFORMATION The information related to I/O network is displayed in the display format below:
: : I/O type: Module type Shown as Input module I Output module O Other * Network type: Network type Shown - Page 445B-63945EN/02 7.INTERFACE BETWEEN CNC AND PMC Status: the status of communication “OK” or “NG” is displayed. REMARK The remarks up to 8 characters extracted from comment data are displayed. To specify the remark at this field, set “100” to the attribute value of the comment, which you want to show in
- Page 4467.INTERFACE BETWEEN CNC AND PMC B-63945EN/02 7.6 LADDER DIAGRAM MONITOR AND EDITOR SCREENS ([PMC LADDER]) The PMC LADDER menu contains the screens related to PMC Ladder diagrams, such as the program list screen and the LADDER DIAGRAM MONITOR/EDITOR screens. You can switch to the PMC LADDER menu by o
- Page 447B-63945EN/02 7.INTERFACE BETWEEN CNC AND PMC The following screens can be called from the LADDER DIAGRAM EDITOR screen: (7) FUNCTIONAL INSTRUCTION DATA TABLE VIEWER screen Allows you to view the contents of the data table for a data table attached functional instruction. (8) FUNCTIONAL INSTRUCTION D
- Page 4487.INTERFACE BETWEEN CNC AND PMC B-63945EN/02 7.6.1 Displaying a Program List ([LIST] Screen) The PROGRAM LIST VIEWER screen shows program information such as the program size. SP area Size area Ladder preview display area Program number area Key input line Message display line (1) Screen structures
- Page 449B-63945EN/02 7.INTERFACE BETWEEN CNC AND PMC (2) Area of program list (a) In the "SP area", the protect information for subprograms is displayed, so are their program types. (Key): Ladder program, cannot be viewed, cannot be edited (Magnifying glass): Ladder program, can be viewed, cannot be edited
- Page 4507.INTERFACE BETWEEN CNC AND PMC B-63945EN/02 7.6.2 Monitoring Ladder Diagrams ([LADDER] Screen) LADDER DIAGRAM MONITOR screen shows the on/off status of contacts and coils, and the contents of address specified for parameter of functional instructions. From the PMC LADDER menu, you can switch to the
- Page 451B-63945EN/02 7.INTERFACE BETWEEN CNC AND PMC (b) In the additional information line near the bottom of the screen, the following information of the address under the cursor when the cursor is shown. • Net number of the net with the cursor • Address and its symbol and comment information • Current va
- Page 4527.INTERFACE BETWEEN CNC AND PMC B-63945EN/02 (4) Displaying Symbols and Comments (a) Usually, addresses are displayed above contacts and coils. For an address with a symbol assigned, you can change the setting so that the symbol is displayed instead of the address. You can add colors to addresses. F
- Page 453B-63945EN/02 7.INTERFACE BETWEEN CNC AND PMC 7.6.3 Editing Ladder Programs At LADDER DIAGRAM EDITOR screen you can edit LADDER program to change its behavior. To switch LADDER DIAGRAM EDITOR screen, press [EDIT] soft key at LADDER DIAGRAM MONITOR screen. Following operations are available at LADDER
- Page 4547.INTERFACE BETWEEN CNC AND PMC B-63945EN/02 CAUTION 1 You can edit ladder programs regardless of whether they are active or not. To execute a ladder program with the results of editing being reflected, you must update the ladder program. To do this, click the [UPDATE] soft key, or update the progra
- Page 455B-63945EN/02 7.INTERFACE BETWEEN CNC AND PMC Soft keys of LADDER Diagram Editor screen Program List Change to Search soft keys Select net Copy net Edit new net Delete net Cut net Paste net Automatic input Add net Make changes effective Exit Change address Setting screen Cancel edit Abandon changes R
- Page 4567.INTERFACE BETWEEN CNC AND PMC B-63945EN/02 7.6.3.1 NET EDITOR screen At NET EDITOR screen, you can create new net, and modify existing net. • Changing existing nets If you move a net with the [ZOOM] soft key, you will enter a mode (Modify mode) in which you can add changes to the net currently ind
- Page 457B-63945EN/02 7.INTERFACE BETWEEN CNC AND PMC (1) Screen structures (a) It is basically same with LADDER DIAGRAM EDITOR screen, except that only one net is in this screen, and that position bar at right edge of screen does not appear at this screen. (b) Current edit mode is indicated at right of the
- Page 4587.INTERFACE BETWEEN CNC AND PMC B-63945EN/02 7.6.4 PROGRAM LIST EDITOR Screen At PROGRAM LIST EDITOR screen you can create new program and delete a program in addition to the function of PROGRAM LIST VIEWER screen. To reach this screen, press [LIST] soft key at LADDER DIAGRAM EDITOR screen. Followin
- Page 459B-63945EN/02 7.INTERFACE BETWEEN CNC AND PMC 7.6.5 Collective Monitor Function The COLLECTIVE MONITOR screen allows you to specify the ladder net containing the coils to be monitored, so that you can monitor only the necessary ladder net. The COLLECTIVE MONITOR screen can be called in either of the
- Page 4607.INTERFACE BETWEEN CNC AND PMC B-63945EN/02 7.6.5.1 COLLECTIVE MONITOR function The COLLECTIVE MONITOR screen is such as that shown below. At first, it does not display any ladder diagram. Ladder nets will be added to this screen as they are selected with coil search and pickup operations. Up to 12
- Page 461B-63945EN/02 7.INTERFACE BETWEEN CNC AND PMC • Indication from a ladder net on the COLLECTIVE MONITOR screen Indicate a relay on an already picked up ladder net, with the cursor, to pick up the net that uses the relay address for the coil. (b) Specifying a ladder net from the LADDER DIAGRAM MONITOR
- Page 4627.INTERFACE BETWEEN CNC AND PMC B-63945EN/02 (4) Picking up a ladder net from the LADDER DIAGRAM MONITOR screen You can pick up a ladder net from the LADDER DIAGRAM MONITOR screen. The procedure for picking up a ladder net is as described below. (a) From the LADDER DIAGRAM MONITOR screen, click the
- Page 463B-63945EN/02 7.INTERFACE BETWEEN CNC AND PMC 7.7 LIST OF ADDRESSES Interface addresses among CNC and PMC are as follows: [Example of controlling one path using one PMC] G0000~ X000~ CNC PMC Machine tool F0000~ Y000~ [Example of controlling three path using one PMC] CNC G0000~ X000~ Path 1 F0000~ Y00
- Page 4647.INTERFACE BETWEEN CNC AND PMC B-63945EN/02 [Example of controlling multipath CNC using PMC system] CNC Signal PMC I/F G0000~ G0000~ Path 1 X000~ F0000~ F0000~ Y000~ I/O device G1000~ G1000~ First for first PMC machine Path 2 F1000~ F1000~ First G2000~ G2000~ machine Path 3 group F2000~ F2000~ G300
- Page 465B-63945EN/02 7.INTERFACE BETWEEN CNC AND PMC - Expression of signals Address Symbol (#0 to #7 indicates bit position) #7 #6 #5 #4 #3 #2 #1 #0 Fn000 OP SA STL SPL RWD In an item where both lathe system and machining center system are described, some signals are covered with shade ( ) in the signal ad
- Page 4667.INTERFACE BETWEEN CNC AND PMC B-63945EN/02 MT → CNC Address Bit number 7 6 5 4 3 2 1 0 X000 X001 X002 X003 X004 ESKIP -MIT2#1 +MIT2#1 -MIT1#1 +MIT1#1 #1 SKIP T series SKIP6 #1 SKIP5 #1 SKIP4 #1 SKIP3 #1 SKIP2 #1 SKIP8 #1 SKIP7 #1 X004 ESKIP SKIP #1 SKIP5 #1 SKIP4 #1 SKIP3 #1 M series SKIP6 #1 SKIP
- Page 467B-63945EN/02 7.INTERFACE BETWEEN CNC AND PMC PMC → CNC Address Bit number 7 6 5 4 3 2 1 0 Gn000 Gn001 Gn002 Gn003 Gn004 MFIN3#P MFIN2#P FIN#P Gn005 BFIN#P AFL#P TFIN#P SFIN#P MFIN#P Gn006 SKIPP#P OVC#P *ABSM #P SRN#P Gn007 RLSOT #P EXLM#P *FLWU #P RLSOT3#P ST#P STLK#P Gn008 ERS#P RRW#P *SP#P *ESP#P
- Page 4687.INTERFACE BETWEEN CNC AND PMC B-63945EN/02 Address Bit number 7 6 5 4 3 2 1 0 Gn021 Gn022 #P #P Gn023 ALNGH #P RGHTH HNDLF Gn024 Gn025 Gn026 *SSTP4#SP SWS4#SP PC4SLC#P PC3SLC#P SWS3#SP Gn027 CON#P *SSTP3#SP *SSTP2#SP *SSTP1#SP SWS2#SP SWS1#SP *SCPFA#SP Gn028 PC2SLC#P SPSTPA#SP *SUCPFA#SP GR2#SP GR
- Page 469B-63945EN/02 7.INTERFACE BETWEEN CNC AND PMC Address Bit number 7 6 5 4 3 2 1 0 Gn043 ZRN#P DNCI#P MD4#P MD2#P MD1#P Gn044 MLK#P BDT1#P Gn045 BDT9#P BDT8#P BDT7#P BDT6#P BDT5#P BDT4#P BDT3#P BDT2#P Gn046 DRN#P KEY4 KEY3 KEY2 KEY1 SBK#P Gn047 Gn048 TLRST #P TLRSTI #P TLSKP #P Gn049 *TLV7#P *TLV6#P *T
- Page 4707.INTERFACE BETWEEN CNC AND PMC B-63945EN/02 Address Bit number 7 6 5 4 3 2 1 0 Gn065 Gn066 EKSET RTRCT #P IGNVRY#P Gn067 HCREQ HCABT Gn068 Gn069 Gn070 MRDYA#SP ORCMA#SP SFRA#SP SRVA #SP CTH1A#SP CTH2A#SP TLMHA#SP TLMLA#SP Gn071 RCHA #SP RSLA#SP INTGA #SP SOCNA#SP MCFNA#SP SPSLA#SP *ESPA #SP ARSTA#S
- Page 471B-63945EN/02 7.INTERFACE BETWEEN CNC AND PMC Address Bit number 7 6 5 4 3 2 1 0 Gn087 Gn088 Gn089 #P Gn090 G2SLC G2Y#P G2Z#P G2X#P G2RVY #P G2RVZ #P G2RVX #P Gn091 Gn092 Gn093 Gn094 Gn095 Gn096 HROV#P *HROV6#P *HROV5#P *HROV4#P *HROV3#P *HROV2#P *HROV1#P *HROV0#P Gn097 Gn098 EKC7 EKC6 EKC5 EKC4 EKC3
- Page 4727.INTERFACE BETWEEN CNC AND PMC B-63945EN/02 Address Bit number 7 6 5 4 3 2 1 0 Gn109 *-ED38#SV *-ED37#SV *-ED36#SV *-ED35#SV *-ED34#SV *-ED33#SV *-ED32#SV *-ED31#SV Gn110 +LM8#SV +LM7#SV +LM6#SV +LM5#SV +LM4#SV +LM3#SV +LM2#SV +LM1#SV Gn111 Gn112 -LM8#SV -LM7#SV -LM6#SV -LM5#SV -LM4#SV -LM3#SV -LM2
- Page 473B-63945EN/02 7.INTERFACE BETWEEN CNC AND PMC Address Bit number 7 6 5 4 3 2 1 0 Gn131 Gn132 +MIT8#P +MIT7#P +MIT6#P +MIT5#P +MIT4#P +MIT3#P +MIT2#P +MIT1#P Gn133 Gn134 -MIT8#P -MIT7#P -MIT6#P -MIT5#P -MIT4#P -MIT3#P -MIT2#P -MIT1#P Gn135 Gn136 EAX8#SV EAX7#SV EAX6#SV EAX5#SV EAX4#SV EAX3#SV EAX2#SV
- Page 4747.INTERFACE BETWEEN CNC AND PMC B-63945EN/02 Address Bit number 7 6 5 4 3 2 1 0 Gn153 Gn154 EBUF#PX ECLR#PX ESTP#PX ESOF#PX ESBK#PX EMBUF#PX ELCKZ#PX EFIN #PX Gn155 EMSBK#PX EC6#PX EC5#PX EC4#PX EC3#PX EC2#PX EC1#PX EC0#PX Gn156 EIF7 #PX EIF6 #PX EIF5 #PX EIF4 #PX EIF3 #PX EIF2 #PX EIF1 #PX EIF0 #PX
- Page 475B-63945EN/02 7.INTERFACE BETWEEN CNC AND PMC Address Bit number 7 6 5 4 3 2 1 0 Gn175 *EFOV7#P *EFOV6#P *EFOV5#P *EFOV4#P *EFOV3#P *EFOV2#P *EFOV1#P *EFOV0#P Gn176 Gn177 Gn178 EBUF#PX ECLR#PX ESTP#PX ESOF#PX ESBK#PX EMBUF#PX ELCKZ#PX EFIN #PX Gn179 EMSBK#PX EC6#PX EC5#PX EC4#PX EC3#PX EC2#PX EC1#PX
- Page 4767.INTERFACE BETWEEN CNC AND PMC B-63945EN/02 Address Bit number 7 6 5 4 3 2 1 0 Gn197 Gn198 IOLBH2 IOLBH1 Gn199 Gn200 EASIP8#SV EASIP7#SV EASIP6#SV EASIP5#SV EASIP4#SV EASIP3#SV EASIP2#SV EASIP1#SV Gn201 Gn202 NDCAL8#SV NDCAL7#SV NDCAL6#SV NDCAL5#SV NDCAL4#SV NDCAL3#SV NDCAL2#SV NDCAL1#SV RWFL Gn203
- Page 477B-63945EN/02 7.INTERFACE BETWEEN CNC AND PMC Address Bit number 7 6 5 4 3 2 1 0 Gn263 Gn264 ESSYC4#SP ESSYC3#SP ESSYC2#SP ESSYC1#SP Gn265 PKESE4#SP PKESE3#SP PKESE2#SP PKESE1#SP Gn266 MRDYD#SP ORCMD#SP SFRD #SP SRVD #SP CTH1D#SP CTH2D#SP TLMHD#SP TLMLD#SP Gn267 RCHD #SP RSLD#SP INTGD #SP SOCND#SP MC
- Page 4787.INTERFACE BETWEEN CNC AND PMC B-63945EN/02 Address Bit number 7 6 5 4 3 2 1 0 Gn285 UI315#P UI314#P UI313#P UI312#P UI311#P UI310#P UI309#P UI308#P Gn286 UI323#P UI322#P UI321#P UI320#P UI319#P UI318#P UI317#P UI316#P Gn287 UI331#P UI330#P UI329#P UI328#P UI327#P UI326#P UI325#P UI324#P Gn288 SPSY
- Page 479B-63945EN/02 7.INTERFACE BETWEEN CNC AND PMC Address Bit number 7 6 5 4 3 2 1 0 Gn307 Gn308 Gn309 Gn310 Gn311 Gn312 Gn313 Gn314 Gn315 Gn316 Gn317 Gn318 Gn319 Gn320 Gn321 Gn322 Gn323 Gn324 Gn325 Gn326 Gn327 Gn328 TLRSTI4 #P TLRSTI3 #P TLRSTI2 #P TLRSTI1 #P TLRST4 #P TLRST3 #P TLRST2 #P TLRST1 #P - 45
- Page 4807.INTERFACE BETWEEN CNC AND PMC B-63945EN/02 Address Bit number 7 6 5 4 3 2 1 0 #P TLNCT4 Gn329 TLNCT3 #P TLNCT2 #P TLNCT1 #P TLSKP4 #P TLSKP3 #P TLSKP2 #P TLSKP1 #P Gn330 TKEY5 #P TKEY4 #P TKEY3 #P TKEY2 #P TKEY1 #P TKEY0 #P Gn331 Gn332 Gn333 Gn334 Gn335 Gn336 Gn337 Gn338 Gn339 Gn340 Gn341 *+ED48 #
- Page 481B-63945EN/02 7.INTERFACE BETWEEN CNC AND PMC Address Bit number 7 6 5 4 3 2 1 0 Gn351 Gn352 *FHRO7#P *FHRO6#P *FHRO5#P *FHRO4#P *FHRO3#P *FHRO2#P *FHRO1#P *FHRO0#P Gn353 FHROV#P *FHRO9#P *FHRO8#P Gn354 THD07 #P THD06 #P THD05 #P THD04 #P THD03 #P THD02 #P THD01 #P THD00 #P Gn355 THD15 #P THD14 #P TH
- Page 4827.INTERFACE BETWEEN CNC AND PMC B-63945EN/02 Address Bit number 7 6 5 4 3 2 1 0 Gn411 HS4IE#P HS3IE#P HS2IE#P HS1IE#P HS4E#P HS3E#S HS2E#P HS1E#P Gn412 Gn413 Gn414 Gn415 Gn416 Gn417 Gn418 Gn419 Gn420 Gn421 SKIP4#P Gn422 SKIP3#P SKIP2#P Gn423 Gn424 Gn425 Gn426 Gn427 Gn428 Gn429 Gn430 Gn431 Gn432 - 45
- Page 483B-63945EN/02 7.INTERFACE BETWEEN CNC AND PMC Address Bit number 7 6 5 4 3 2 1 0 Gn433 Gn434 Gn435 Gn436 Gn437 Gn438 Gn439 Gn440 Gn441 Gn442 Gn443 Gn444 Gn445 Gn446 Gn447 Gn448 Gn449 Gn450 to SEMI8 #SV SEMI7#SV SEMI6#SV SEMI5#SV SEMI4#SV SEMI3#SV SEMI2#SV SEMI1#SV Gn516 to Gn767 - 455 -
- Page 4847.INTERFACE BETWEEN CNC AND PMC B-63945EN/02 CNC → PMC Address Bit number 7 6 5 4 3 2 1 0 #P #P #P #P Fn000 OP SA STL SPL RWD#P Fn001 MA#P TAP#P ENB#SP DEN#P BAL#P RST#P AL#P Fn002 MDRN#P CUT#P SRNMV#P THRD#P CSS#P RPDO#P INCH#P Fn003 MEDT#P MMEM# MRMT#P MMDI#P MJ#P MH#P MINC#P Fn004 MREF#P MAFL#P M
- Page 485B-63945EN/02 7.INTERFACE BETWEEN CNC AND PMC Address Bit number 7 6 5 4 3 2 1 0 Fn021 Fn022 S07#P S06#P S05#P S04#P S03#P S02#P S01#P S00#P Fn023 S15#P S14#P S13#P S12#P S11#P S10#P S09#P S08#P Fn024 S23#P S22#P S21#P S20#P S19#P S18#P S17#P S16#P Fn025 S31#P S30#P S29#P S28#P S27#P S26#P S25#P S24#
- Page 4867.INTERFACE BETWEEN CNC AND PMC B-63945EN/02 Address Bit number 7 6 5 4 3 2 1 0 Fn043 SYCAL4#SP SYCAL3#SP SYCAL2#SP SYCAL1#SP #P FSPPH Fn044 SYCAL #P FSPSYC#P FSCSL #P Fn045 ORARA#SP TLMA#SP LDT2A #SP LDT1A #SP SARA #SP SDTA#SP SSTA#SP ALMA #SP Fn046 MORA2A#SP MORA1A#SP PORA2A#SP SLVSA #SP RCFNA#SP
- Page 487B-63945EN/02 7.INTERFACE BETWEEN CNC AND PMC Address Bit number 7 6 5 4 3 2 1 0 Fn065 SYNMOD# RTRCTF#P RSMAX #P RSPM#P RSPP#P Fn066 PECK2 #P RTPT#P Fn067 Fn068 Fn069 Fn070 PSW08 #P PSW07 #P PSW06 #P PSW05 #P PSW04 #P PSW03 #P PSW02 #P PSW01 #P Fn071 Fn072 OUT7#P OUT6#P OUT5#P OUT4#P OUT3#P OUT2#P OU
- Page 4887.INTERFACE BETWEEN CNC AND PMC B-63945EN/02 Address Bit number 7 6 5 4 3 2 1 0 Fn087 Fn088 Fn089 ABTQSV#P Fn090 ABTSP3#SP ABTSP2#SP ABTSP1#SP Fn091 ABTSP4#SP Fn092 TRSPS #P TRMTN #P TRACT #P Fn093 SVWRN4#P SVWRN3#P SVWRN2#P SVWRN1#P Fn094 ZP8#SV ZP7#SV ZP6#SV ZP5#SV ZP4#SV ZP3#SV ZP2#SV ZP1#SV Fn09
- Page 489B-63945EN/02 7.INTERFACE BETWEEN CNC AND PMC Address Bit number 7 6 5 4 3 2 1 0 Fn109 Fn110 MDTCH8#SV MDTCH7#SV MDTCH6#SV MDTCH5#SV MDTCH4#SV MDTCH3#SV MDTCH2#SV MDTCH1#SV Fn111 Fn112 EADEN8#SV EADEN7#SV EADEN6#SV EADEN5#SV EADEN4#SV EADEN3#SV EADEN2#SV EADEN1#SV Fn113 Fn114 TRQL8 #SV TRQL7 #SV TRQL
- Page 4907.INTERFACE BETWEEN CNC AND PMC B-63945EN/02 Address Bit number 7 6 5 4 3 2 1 0 Fn131 EMF3A#PX EMF2A#PX EABUFA#PX EMFA #PX Fn132 EM28A#PX EM24A#PX EM22A#PX EM21A#PX EM18A#PX EM14A#PX EM12A#PX EM11A#PX Fn133 EBSYB#PX EOTNB#PX EOTPB#PX EGENB#PX EDENB#PX EIALB #PX ECKZB#PX EINPB #PX Fn134 EMF3B#PX EMF2
- Page 491B-63945EN/02 7.INTERFACE BETWEEN CNC AND PMC Address Bit number 7 6 5 4 3 2 1 0 Fn153 Fn154 Fn155 Fn156 Fn157 Fn158 Fn159 Fn160 MSP07 #P MSP06 #P MSP05 #P MSP04 #P MSP03 #P MSP02 #P MSP01 #P MSP00 #P Fn161 MSP15 #P MSP14 #P MSP13 #P MSP12 #P MSP11 #P MSP10 #P MSP09 #P MSP08 #P Fn162 Fn163 Fn164 Fn16
- Page 4927.INTERFACE BETWEEN CNC AND PMC B-63945EN/02 Address Bit number 7 6 5 4 3 2 1 0 Fn175 Fn176 Fn177 Fn178 Fn179 Fn180 Fn181 Fn182 EACNT8#SV EACNT7#SV EACNT6#SV EACNT5#SV EACNT4#SV EACNT3#SV EACNT2#SV EACNT1#SV Fn183 ABDT8#SV Fn184 ABDT7#SV ABDT6#SV ABDT5#SV ABDT4#SV ABDT3#SV ABDT2#SV ABDT1#SV Fn185 Fn
- Page 493B-63945EN/02 7.INTERFACE BETWEEN CNC AND PMC Address Bit number 7 6 5 4 3 2 1 0 Fn197 Fn198 Fn199 MCHAO#P Fn200 R08O2#SP R07O2#SP R06O2#SP R05O2#SP R04O2#SP R03O2#SP R02O2#SP R01O2#SP Fn201 R12O2#SP R11O2#SP R10O2#SP R09O2#SP Fn202 AR072 #SP AR062 #SP AR052 #SP AR042 #SP AR032 #SP AR022 #SP AR012 #S
- Page 4947.INTERFACE BETWEEN CNC AND PMC B-63945EN/02 Address Bit number 7 6 5 4 3 2 1 0 Fn241 Fn242 Fn243 Fn244 Fn245 Fn246 Fn247 Fn248 Fn249 Fn250 Fn251 Fn252 Fn253 Fn254 ALR12#P ALR11#P ALR10#P ALR9#P ALR8#P Fn255 Fn256 Fn257 Fn258 Fn259 Fn260 Fn261 Fn262 - 466 -
- Page 495B-63945EN/02 7.INTERFACE BETWEEN CNC AND PMC Address Bit number 7 6 5 4 3 2 1 0 Fn263 Fn264 SPWRN8 #P SPWRN7 #P SPWRN6 #P SPWRN5 #P SPWRN4 #P SPWRN3 #P SPWRN2 #P SPWRN1 #P Fn265 SPWRN9 #P Fn266 ORARD#SP TLMD#SP LDT2D#SP LDT1D#SP SARD #SP SDTD #SP SSTD#SP ALMD #SP Fn267 MORA2D#SP MORA1D#SP PORA2D#SP
- Page 4967.INTERFACE BETWEEN CNC AND PMC B-63945EN/02 Address Bit number 7 6 5 4 3 2 1 0 Fn285 UO315 #P UO314 #P UO313 #P UO312 #P UO311 #P UO310 #P UO309 #P UO308 #P Fn286 UO323 #P UO322 #P UO321 #P UO320 #P UO319 #P UO318 #P UO317 #P UO316 #P Fn287 UO331 #P UO330 #P UO329 #P UO328 #P UO327 #P UO326 #P UO32
- Page 497B-63945EN/02 7.INTERFACE BETWEEN CNC AND PMC Address Bit number 7 6 5 4 3 2 1 0 Fn307 Fn308 Fn309 Fn310 Fn311 Fn312 Fn313 Fn314 Fn315 TLMEM#P TMFNFD#P TLMOT#P TLMG10#P TLMSRH#P TLSKF#P Fn316 Fn317 Fn318 Fn319 Fn320 Fn321 Fn322 Fn323 Fn324 Fn325 Fn326 Fn327 Fn328 TLCHI4#P TLCHI3#P TLCHI2#P TLCHI1#P T
- Page 4987.INTERFACE BETWEEN CNC AND PMC B-63945EN/02 Address Bit number 7 6 5 4 3 2 1 0 Fn329 TLCHB4#P TLCHB3#P TLCHB2#P TLCHB1#P TLSKF4#P TLSKF3#P TLSKF2#P TLSKF1#P Fn330 Fn331 Fn332 Fn333 Fn334 Fn335 Fn336 Fn337 Fn338 Fn339 Fn340 Fn341 SYCM8#SV SYCM7#SV SYCM6#SV SYCM5#SV SYCM4#SV SYCM3#SV SYCM2#SV SYCM1#S
- Page 499B-63945EN/02 7.INTERFACE BETWEEN CNC AND PMC Address Bit number 7 6 5 4 3 2 1 0 Fn356 THREND#P MTHML#P Fn395 Fn396 Fn397 Fn398 Fn399 Fn400 SUCLPD#SP SUCLPC#SP SUCLPB#SP Fn401 SCLPD#SP SCLPC#SP SCLPB#SP Fn402 MSPOSD#SP MSPOSC#SP MSPOSB#SP Fn403 SYNER #P Fn404 COSP4 #P COSP3 #P Fn405 Fn406 Fn407 Fn408
- Page 5007.INTERFACE BETWEEN CNC AND PMC B-63945EN/02 Address Bit number 7 6 5 4 3 2 1 0 Fn416 Fn417 Fn418 Fn419 Fn414 to MSEMI8#SV MSEMI7#SV MSEMI6#SV MSEMI5#SV MSEMI4#SV MSEMI3#SV MSEMI2#SV MSEMI1#SV Fn516 Fn517 RP18 RP17 RP16 RP15 RP14 RP13 RP12 RP11 Fn518 RP28 RP27 RP26 RP25 RP24 RP23 RP22 RP21 Fn519 to
- Page 501B-63945EN/02 8.EMBEDDED ETHERNET FUNCTION 8 EMBEDDED ETHERNET FUNCTION This chapter describes the specifications of the embedded Ethernet function. 8.1 EMBEDDED ETHERNET PORT AND PCMCIA ETHERNET CARD..................................................................474 8.2 SETTING UP THE EMBEDDED ETH
- Page 5028.EMBEDDED ETHERNET FUNCTION B-63945EN/02 8.1 EMBEDDED ETHERNET PORT AND PCMCIA ETHERNET CARD The embedded Ethernet function can be used by selecting one of two types of devices: the embedded Ethernet port and PCMCIA Ethernet card. The PCMCIA Ethernet card is to be inserted into the memory card slot
- Page 503B-63945EN/02 8.EMBEDDED ETHERNET FUNCTION 8.2 SETTING UP THE EMBEDDED ETHERNET FUNCTION This section describes the setting of parameters for the embedded Ethernet function. 8.2.1 Parameter Setting of the FOCAS2/Ethernet Function This subsection describes the settings required to operate the FOCAS2/E
- Page 5048.EMBEDDED ETHERNET FUNCTION B-63945EN/02 Settings of the FOCAS2/Ethernet function - Settings on the COMMON screen Item Description IP ADDRESS Specify the IP address of the embedded Ethernet. (Example of specification format: "192.168.0.100") SUBNET MASK Specify a mask address for the IP addresses o
- Page 505B-63945EN/02 8.EMBEDDED ETHERNET FUNCTION - FOCAS2/Ethernet setting items Item Description PORT NUMBER Specify a port number to be used with the (TCP) FOCAS2/Ethernet function. The valid input range is 5001 to 65535. PORT NUMBER Set this item to 0 when it is used as the (UDP) FOCAS2/Ethernet functio
- Page 5068.EMBEDDED ETHERNET FUNCTION B-63945EN/02 - Initial setting of the PCMCIA Ethernet card The PCMCIA Ethernet card is factory-set to the following default values, for ease of connection with a servo guide or FANUC LADDER-III. IP ADDRESS : 192.168.1.1 SUBNET MASK : 255.255.255.0 ROUTER IP ADDRESS : Non
- Page 507B-63945EN/02 8.EMBEDDED ETHERNET FUNCTION Example of setting the FOCAS2/Ethernet function The following shows a setting example required for the FOCAS2/Ethernet function to operate. In this example, one personal computer is connected to two CNCs through FOCAS2/Ethernet. HUB 10BASE-T or 100BASE-TX CN
- Page 5088.EMBEDDED ETHERNET FUNCTION B-63945EN/02 8.2.2 Setting Parameters for The FTP File Transfer Function This section describes the settings required for the FTP file transfer function to operate using the embedded Ethernet function. Notes on using the FTP file transfer function for the first time NOTE
- Page 509B-63945EN/02 8.EMBEDDED ETHERNET FUNCTION Settings for the FTP file transfer function - Settings on the COMMON screen Item Description IP ADDRESS Specify the IP address of the embedded Ethernet. (Example of specification format: "192.168.0.100") SUBNET MASK Specify a mask address for the IP addresse
- Page 5108.EMBEDDED ETHERNET FUNCTION B-63945EN/02 Settings on the FTP transfer screen PAGE Page keys PAGE can be used to make settings for the three host computers for connection destinations 1 to 3. FTP transfer screen (1st page) FTP transfer screen (2nd page) Item Description HOST NAME Specify the IP addr
- Page 511B-63945EN/02 8.EMBEDDED ETHERNET FUNCTION Changing the host computer to be connected for the FTP file transfer function Select a destination. 1 Pressing the [(OPRT)] soft key causes soft key [HOST SELECT] to be displayed. Pressing this soft key causes soft keys [CONECT 1], [CONECT 2], and [CONECT 3]
- Page 5128.EMBEDDED ETHERNET FUNCTION B-63945EN/02 Related NC parameters The NC parameters related to the FTP file transfer function are described below. 0020 I/O CHANNEL : Input/output device selection [Data type] Byte [Valid data range] 9 : Select the embedded Ethernet as the input/output device. For built
- Page 513B-63945EN/02 8.EMBEDDED ETHERNET FUNCTION Example of setting the FTP file transfer function The following shows a setting example required for the FTP file transfer function to operate. (WindowsXP Professional is used as the OS for the personal computer). In this example, one personal computer is co
- Page 5148.EMBEDDED ETHERNET FUNCTION B-63945EN/02 8.2.3 Setting Up the DNS/DHCP Function The DHCP/DNS function is set up by using the COMMON screen (detail) and NC parameters. 8.2.3.1 Setting up DNS This subsection describes the procedure for setting up a DNS. Procedure 1 Enable the DNS function, with refer
- Page 515B-63945EN/02 8.EMBEDDED ETHERNET FUNCTION Display item Item Description DNS IP Up to two DNS IP addresses can be specified. ADDRESS 1, 2 The CNC searches for the DNS server using DNS IP addresses 1 and 2 in that order. 8.2.3.2 Setting up DHCP This subsection describes the procedure for setting up a
- Page 5168.EMBEDDED ETHERNET FUNCTION B-63945EN/02 COMMON screen PAGE After pressing soft key [COMMON], press either page key PAGE to call a desired Ethernet common setting screen (basic, detail). If the DHCP server is connected successfully and if the setting data can be obtained, the screen is displayed as
- Page 517B-63945EN/02 8.EMBEDDED ETHERNET FUNCTION Check item Item Description IP ADDRESS If the DHCP server is connected successfully, SUBNET MASK the items obtained from the DHCP server are ROUTER IP ADDRESS displayed. DNS IP ADDRESS 1,2 If the DHCP server cannot be connected, DOMAIN "DHCP ERROR" is displa
- Page 5188.EMBEDDED ETHERNET FUNCTION B-63945EN/02 8.3 SWITCHING BETWEEN THE EMBEDDED ETHERNET DEVICES There are two types of embedded Ethernet devices: the embedded Ethernet port and PCMCIA Ethernet card. Screen operation is required to switch between these two types of devices. Procedure 1 Press the functi
- Page 519B-63945EN/02 8.EMBEDDED ETHERNET FUNCTION 8.4 EMBEDDED ETHERNET OPERATIONS 8.4.1 FTP File Transfer Function The operation of the FTP file transfer function is described below. Host file list display A list of the files held on the host computer is displayed. Procedure 1 Press the function key PROG .
- Page 5208.EMBEDDED ETHERNET FUNCTION B-63945EN/02 4 Press soft key [EMB ETHER]. The program directory screen is changed to the contents of the hard disk on the host computer (embedded Ethernet host file list screen). On this screen, you can operate files. Embedded Ethernet host file list screen NOTE When us
- Page 521B-63945EN/02 8.EMBEDDED ETHERNET FUNCTION REGISTERED PROGRAM The number of programs in the current folder. DEVICE Current device. When the embedded Ethernet host file list is selected, “EMB_ETHER” is displayed. CURRENT FOLDER Current work folder in the host computer FILE LIST Information of the file
- Page 5228.EMBEDDED ETHERNET FUNCTION B-63945EN/02 8.4.1.1 Displaying and operating the file list REFRESH, DETAIL ON, DETAIL OFF Update the file list data or change the file list type. 1 Press soft key [REFRESH] to update the file list data. 2 Press soft key [DETAIL ON] to display only file names. 3 Press so
- Page 523B-63945EN/02 8.EMBEDDED ETHERNET FUNCTION DELETE (multiple files) Delete multiple files at a time. 1 Press soft key [SELECT START]. 2 Select a file or folder you want to delete using cursor keys and . 3 Press soft key [SELECT]. The selected file is highlighted. Repeat steps 2 and 3 for each file you
- Page 5248.EMBEDDED ETHERNET FUNCTION B-63945EN/02 8.5 RESTART OF THE EMBEDDED ETHERNET Communication using the embedded Ethernet can be restarted. Procedure 1 Press the function key SYSTEM . 2 Soft keys [EMBED] and [PCMCIA] appear. (When there is no soft keys, press the continue key.) 3 Press soft key [EMBE
- Page 525B-63945EN/02 8.EMBEDDED ETHERNET FUNCTION 8.6 MAINTENANCE SCRESSN FOR EMBEDDED ETHERNET FUNCTION With the embedded Ethernet function, a dedicated maintenance screen is available. The maintenance screen enables operations to be checked when the embedded Ethernet function operates abnormally. Displayi
- Page 5268.EMBEDDED ETHERNET FUNCTION B-63945EN/02 6 To send the PING command to the desired destination, enter the address of the destination on the PING setting screen. (Page keys PAGE PAGE are used for switching.) PING connection status screen 7 After entering the address and the REPEAT count, press the s
- Page 527B-63945EN/02 8.EMBEDDED ETHERNET FUNCTION Displaying Communication status screen Procedure 1 Press the function key SYSTEM . 2 Soft keys [EMBED] and [PCMCIA LAN] appear. (When there is no soft keys, press the continue key.) 3 By pressing the [EMBED] soft key, the Ethernet Setting screen for the embe
- Page 5288.EMBEDDED ETHERNET FUNCTION B-63945EN/02 Displaying a software status screen Procedure 1 Press the function key SYSTEM . 2 Soft keys [EMBED] and [PCMCIA LAN] appear. (When there is no soft keys, press the continue key.) 3 To display the Ethernet Setting screen for the embedded Ethernet port or the
- Page 529B-63945EN/02 8.EMBEDDED ETHERNET FUNCTION 8.7 LOG SCREEN OF THE EMBEDDED ETHERNET FUNCTION This screen displays the log of the embedded Ethernet function. Displaying the log screen Procedure 1 Press the function key SYSTEM . 2 To display the log screen for the embedded Ethernet port or PCMCIA Ethern
- Page 5308.EMBEDDED ETHERNET FUNCTION B-63945EN/02 (2) Soft key [COMMON] Displays the log related to the parameter settings of the embedded Ethernet function and the basic communication function. (3) Soft key [FOCAS2] Displays the log related to the FOCAS2/Ethernet function. (4) Soft key [FTP TRANS] Displays
- Page 531B-63945EN/02 8.EMBEDDED ETHERNET FUNCTION Error No. Log message Description and necessary action E-0A06 Network is too busy An excessive amount of data is flowing over the network. One possible solution is to divide the network. E-0B00 The own IP address is wrong Specify a correct IP address in the
- Page 5329.DIGITAL SERVO B-63945EN/02 9 DIGITAL SERVO This chapter describes servo tuning screen required for maintenance of digital servo and adjustment of reference position. 9.1 INITIAL SETTING SERVO PARAMETERS.........................505 9.2 FSSB DISPLAY AND SETTING SCREEN............................516
- Page 533B-63945EN/02 9.DIGITAL SERVO 9.1 INITIAL SETTING SERVO PARAMETERS This section describes how to set initial servo parameters, which is used for field adjustment of machine tool. 1. Turn on power at the emergency stop condition. 2. Set the parameter to display the servo tuning screen. #7 #6 #5 #4 #3
- Page 5349.DIGITAL SERVO B-63945EN/02 (1) Initial set bit #7 #6 #5 #4 #3 #2 #1 #0 2000 PRMCAL DGPRM PLC01 #3 PRMCAL 1: Turns to 1 when the initial setting is done. #1 DGPRM 0: Initial setting of digital servo parameter is done. 1: Initial setting of digital servo parameter is not done. #0 PLC01 0: Values of
- Page 535B-63945EN/02 9.DIGITAL SERVO Table 9.1 (c) α(HV)is series servo motor Motor Motor model Motor type No. 90D0 90E0 specification α2/5000HVis 0213 263 A A α4/5000HVis 0216 266 A A α8/4000HVis 0236 286 A A α12/4000HVis 0239 289 A A α22/4000HVis 0266 316 A A α30/4000HVis 0269 319 A A α40/4000HVis 0273 32
- Page 5369.DIGITAL SERVO B-63945EN/02 Motor Motor model Motor type No. 90D0 90E0 specification β8/3000is 0075 258 B B β12/3000is 0078 272 B B β22/2000is 0085 274 B B Loading is possible with the servo software of the series and edition listed above or subsequent editions. Table 9.1 (g) Linear motor Motor Mot
- Page 537B-63945EN/02 9.DIGITAL SERVO Motor Motor model Motor type No. 90D0 90E0 specification 6000B/2(200V) 0412-B911 92 (*) A A 6000B/4(200V, 160A) 0412-B811 127 (*) A A 9000B/2(200V, 160A) 0413-B911 128 (*) A A 9000B/4(200V, 360A) 0413-B811 129 (*) A A 15000C/2(200V, 160A) 0414-B911 130 (*) A A 15000C/3(2
- Page 5389.DIGITAL SERVO B-63945EN/02 (6) N/M of feed gear (F⋅FG) 2084 n for flexible feed gear 2085 m for flexible feed gear Setting for the α Pulsecoder in the semi-closed mode Necessary position F⋅FG numerator (≤ 32767) feedback pulses per motor revolution (as irreducible = fraction) F⋅FG denominator (≤ 3
- Page 539B-63945EN/02 9.DIGITAL SERVO Setting for use of a separate detector (full-closed) Number of position pulses corresponding to a F⋅FG numerator (≤ 32767) predetermined amount of travel (as F⋅FG denominator (≤ 32767) = Number of position pulses irreducible corresponding to a fraction) predetermined amo
- Page 5409.DIGITAL SERVO B-63945EN/02 NOTE 1 Setting of the number of position pulses for the semi-closed loop (indicated by (*1) in the above table) Set 12500. 2 As the number of position pulses, set the number of pulses fed back from a separate detector when the motor makes one revolution. (The flexible fe
- Page 541B-63945EN/02 9.DIGITAL SERVO With a position feedback pulse conversion coefficient, the number of position pulses is set using the product of two parameters. 2185 Conversion coefficient for the number of position feedback pulses (Example of setting) When a linear scale with a minimum resolution of 0
- Page 5429.DIGITAL SERVO B-63945EN/02 If there is an error between the required number of position pulses per motor revolution and the setting of the reference counter, the reference position varies, depending on the start point. Such an error needs to be eliminated by changing the detection unit. In this ca
- Page 543B-63945EN/02 9.DIGITAL SERVO CAUTION In addition to the parameters listed above, there are parameters to be set using the detection unit. This change eliminates an error between the required number of position pulses per motor revolution and the reference counter. Required number of position pulses
- Page 5449.DIGITAL SERVO B-63945EN/02 9.2 FSSB DISPLAY AND SETTING SCREEN Connecting the CNC control unit to servo amplifiers via a high-speed serial bus (FANUC Serial Servo Bus, or FSSB), which uses only one fiber optics cable, can significantly reduce the amount of cabling in machine tool electrical sectio
- Page 545B-63945EN/02 9.DIGITAL SERVO <1> Amplifier setting screen The amplifier setting screen consists of two sections: the first section displays information about the slave, while the second section displays information about the separate detector interface units. The amplifier setting screen consists of
- Page 5469.DIGITAL SERVO B-63945EN/02 hyphen (-) and the number of a slave unit connected to the FSSB in the order of connections closer to the CNC. If slaves are connected to the second FSSB line, the slaves are displayed after the slaves connected to the first FSSB line. • AMP (amplifier type) The amplifie
- Page 547B-63945EN/02 9.DIGITAL SERVO <2> Axis setting screen The axis setting screen displays the information shown below: This axis setting screen displays the following items: • AXIS (controlled axis number) This item is the placing of the NC controlled axis. • NAME (controlled axis name) • AMP (type of t
- Page 5489.DIGITAL SERVO B-63945EN/02 <3> Amplifier maintenance screen The amplifier maintenance screen displays maintenance information for servo amplifiers. This screen consists of the following two pages, either of which can be selected by pressing the or key. The amplifier maintenance screen displays the
- Page 549B-63945EN/02 9.DIGITAL SERVO • AXES (maximum number of axes controlled by an amplifier connected to each axis) • CUR. (maximum rating for amplifiers connected to each axis) • EDITION (unit version number of an amplifier connected to each axis) • TEST (date of test performed on an amplifier connected
- Page 5509.DIGITAL SERVO B-63945EN/02 <1> Amplifier setting screen The amplifier setting screen displays the following items: • NO. (controlled axis number) For this item, enter a value of between 1 and the maximum number of controlled axes. If a number that falls outside this range is entered, the warning m
- Page 551B-63945EN/02 9.DIGITAL SERVO <2> Axis setting screen On the axis setting screen, the following items can be specified: • M1 (connector number for separate detector interface uni 1) M2 (connector number for separate detector interface uni 2) M3 (connector number for separate detector interface uni 3)
- Page 5529.DIGITAL SERVO B-63945EN/02 • TNDM Enter odd and even numbers for axes for tandem control or EGB. These numbers must be consecutive and within a range between 1 and the number of controlled axes. If a number that falls outside the valid range is entered, the warning message “DATA IS OUT OF RANGE” i
- Page 553B-63945EN/02 9.DIGITAL SERVO 9.3 SERVO TUNING SCREEN 9.3.1 Parameter Setting Set a parameter to display the servo tuning screen. #7 #6 #5 #4 #3 #2 #1 #0 3111 SVS #0 SVS 0: Servo tuning screen is not displayed. 1: Servo tuning screen is displayed. 9.3.2 Displaying Servo Tuning Screen 1 Press SYSTEM k
- Page 5549.DIGITAL SERVO B-63945EN/02 (14) Loop gain : Actual loop gain (15) Position error : Actual position error (Diagnosis No.300) (16) Current(%) : Indicate current with % to the rated value. (17) Current(A) : Indicate current with A (peak value). (18) Speed RPM : Number of motor actual rotation #7 #6 #
- Page 555B-63945EN/02 9.DIGITAL SERVO Action 1: Related to overcurrent alarms An overcurrent alarm is issued when an excessively large current flows in the main circuit. If an overcurrent alarm is always issued after the emergency stop state is canceled or at the time of gradual acceleration/ deceleration, t
- Page 5569.DIGITAL SERVO B-63945EN/02 9.3.4 Alarms related to the Pulsecoder and Separate Serial Pulsecoder (1) For the αi Pulsecoder An alarm is identified from the data of alarms 1, 2, 3, and 5. The meaning of each bit is indicated below. Alarm 3 Alarm 5 1 Alarm 2 Description Action CSA BLA PHA RCA BZA CKA
- Page 557B-63945EN/02 9.DIGITAL SERVO Action 2: Alarms that may be caused by noise If an alarm is issued intermittently or an alarm is issued after the emergency stop state is canceled, the cause of the alarm is probably noise. In this case, provide sufficient noise protection. If an alarm is issued even aft
- Page 5589.DIGITAL SERVO B-63945EN/02 separate detector outputs position feedback pulses correctly. If the separate detector outputs position feedback pulses correctly, such a situation that only the motor makes turns in the reverse direction at the start of machine movement because of a large backlash betwe
- Page 559B-63945EN/02 9.DIGITAL SERVO 9.3.8 Others An alarm is identified from the data of alarm 5. The meaning of each bit is indicated below. Alarm 5 Description Action OFS MCC LDM PMS FAN DAL ABF 1 Feedback mismatch alarm 1 1 Semi-closed/closed loop excessive error alarm 2 1 Current offset error alarm 3 A
- Page 5609.DIGITAL SERVO B-63945EN/02 increase the alarm level. If this alarm is still issued after changing the level, check the connection direction of the scale. 2078 Dual position feedback conversion coefficient (numerator) 2079 Dual position feedback conversion coefficient (denominator) 2118 Dual positi
- Page 561B-63945EN/02 9.DIGITAL SERVO 9.4 ADJUSTING REFERENCE POSITION (DOG METHOD) Overview Speed Rapid traverse FL rate (PRM1420α) (PRM1425α) Time Rapid traverse acc./dec. time constant (PRM1620α) *DECα PCZ Grid Grid shift amount Reference counter capacity (PRM1850) (PRM1821) 10mm/rev 10000P Error Proporti
- Page 5629.DIGITAL SERVO B-63945EN/02 Parameter There are the following related parameters. #7 #6 #5 #4 #3 #2 #1 #0 1005 DLZx #1 DLZx 0: The normal method (dog) is used for reference position return. 1: Reference position setting without dogs is used (axis by axis). NOTE A reference position can be set axis
- Page 563B-63945EN/02 9.DIGITAL SERVO - Separate type Pulsecoder or linear scale is used 1821 Reference counter capacity per axis [P] Normally, the number of feedback pulses per motor revolution is set to the reference counter capacity. * When plural reference marks are on a linear scale, a quotient of the d
- Page 5649.DIGITAL SERVO B-63945EN/02 9.5 DOGLESS REFERENCE POSITION SETTING When there are no dog nor limit switch for reference position return, this function enables the tool to return the reference position that is set by MTB. When the absolute position detector is used, the reference position once set r
- Page 565B-63945EN/02 9.DIGITAL SERVO Parameter #7 #6 #5 #4 #3 #2 #1 #0 1005 DLZx #1 DLZx 0: The normal method (dog) is used for reference position return. 1: Reference position setting without dogs is used (axis by axis). NOTE A reference position can be set axis by axis by setting parameter DLZx. Reference
- Page 5669.DIGITAL SERVO B-63945EN/02 9.6 αi SERVO WARNING INTERFACE Overview The αi servo system can report the warning status before one of the following target alarms occurs. When the warning status is entered, a report to the PMC is issued. For example, this signal can be used by the machine for retracti
- Page 567B-63945EN/02 9.DIGITAL SERVO 9.7 αi SERVO INFORMATION SCREEN Overview In the αi servo system, ID information output from each of the connected units is obtained and output to the CNC screen. The units that have ID information are shown below. (Remark: Some instances of these units do not have ID inf
- Page 5689.DIGITAL SERVO B-63945EN/02 Displaying the servo information screen 1 Press the SYSTEM function key, then press the [SYSTEM] soft key. 2 Press the [SERVO INFO] soft key to display the screen as shown below. * Servo information is stored in flash ROM. If there is a difference between the ID informat
- Page 569B-63945EN/02 9.DIGITAL SERVO Additional Information Even if replacement is performed reasonably such as for repairing, this function incorrectly indicates the * mark when it detects the replacement. To clear the * mark, follow the steps below to update the registered data, as described in the editin
- Page 5709.DIGITAL SERVO B-63945EN/02 Screen operation Mode Key operation Use Viewing (*1) Page key Scrolls up or down on a screen-by-screen basis. Editing (*2) Soft key [INPUT] Replace the selected ID information at the cursor position with the character string in key-in buffer. [CANCEL] Deletes the charact
- Page 571B-63945EN/02 10.AC SPINDLE 10 AC SPINDLE This chapter outlines the serial interface spindle amplifiers and explains related parameters. 10.1 SERIAL INTERFACE AC SPINDLE .....................................544 10.1.1 OUTLINE OF SPINDLE CONTROL.......................544 10.1.2 SPINDLE SETTING AND TUN
- Page 57210.AC SPINDLE B-63945EN/02 10.1 SERIAL INTERFACE AC SPINDLE 10.1.1 Outline of Spindle Control S command M command NC PMC M03, M04, M05, M19 FIN *SSTP (Spindle stop) Motor speed SOVx (Spindle override) SF, GR1O, GR2O, GR3O (For milling machining) GR1, GR2 (For lathe cutting) S SOR (Orientation) (PRM
- Page 573B-63945EN/02 10.AC SPINDLE 10.1.1.1 Method A of gear change for M series (Parameter No. 3705#2=0) Output Motor speed 4095 Max PRM 3736 Gear 2 Gear 3 Gear 1 0 PRM 3735 S code 0 PRM 3741 PRM 3742 PRM 3743 (min-1) 10.1.1.2 Method B of gear change for M series (Parameter No. 3705#2=1) Output Motor speed
- Page 57410.AC SPINDLE B-63945EN/02 10.1.2 Spindle Setting and Tuning Screen 10.1.2.1 Display method (1) Confirm the parameters #7 #6 #5 #4 #3 #2 #1 #0 3111 SPS #1 SPS 0: The spindle tuning screen is not displayed. 1: The spindle tuning screen is displayed. (2) Press the SYSTEM key to select the screen for s
- Page 575B-63945EN/02 10.AC SPINDLE 10.1.2.2 Spindle setting screen - Gear selection The gear select status on the machine side is displayed. Indication CTH1 CTH2 1 0 0 2 0 1 3 1 0 4 1 1 - Spindle Select a spindle for which data is to be set. S11 : Main spindle amplifier for the 1st spindle S12 : Subspindle
- Page 57610.AC SPINDLE B-63945EN/02 10.1.2.3 Spindle tuning screen - Operation mode 1 : Normal operation 2 : Orientation 3 : Synchronization control 4 : Rigid tapping 5 : Cs contour control 6 : Spindle positioning control - Displayed parameters The displayed parameters vary depending on the operation mode. S
- Page 577B-63945EN/02 10.AC SPINDLE - Displayed monitoring items The displayed monitoring items vary depending on the operation mode. Spindle positioning Normal operation Orientation Synchronization Rigid tapping Cs contour control control control Motor speed Motor speed Motor speed Motor speed Motor speed M
- Page 57810.AC SPINDLE B-63945EN/02 10.1.2.4 Spindle monitor screen - 550 -
- Page 579B-63945EN/02 10.AC SPINDLE - Spindle alarm 1 : Motor overheat 43 : Signal of the differential speed control 79 : Initial test operation error 2 : Excessive speed deviation position coder disconnected 80 : Alarm in SPM communication 3 : DC link fuse blown 46 : Threading position sensor destination 4
- Page 58010.AC SPINDLE B-63945EN/02 Parameter No. 4274: High-speed sub-winding Parameter No. 4093: Low-speed main winding Parameter No. 4279: Low-speed sub-winding - Control input signal Max.10 signals those are ON are displayed from the following signals: TLML Torque limit command (low) SPSL Spindle selecti
- Page 581B-63945EN/02 10.AC SPINDLE 10.1.2.5 Correspondence between operation mode and parameters on spindle tuning screen - Normal operation mode S11: S12: S21: S22: 1st Main 1st Sub 2nd Main 2nd Sub Proportional gain (HIGH) 4040 4206 4040 4206 Proportional gain (LOW) 4041 4207 4041 4207 Integral gain (HIGH
- Page 58210.AC SPINDLE B-63945EN/02 - Rigid tapping mode S11: S12: S21: S22: 1st Main 1st Sub 2nd Main 2nd Sub Proportional gain (HIGH) 4044 4210 4044 4210 Proportional gain (LOW) 4045 4211 4045 4211 Integral gain (HIGH) 4052 4052 4214 4214 Integral gain (LOW) 4053 4053 Loop gain (HIGH) 4065 4065 4221 4221 L
- Page 583B-63945EN/02 10.AC SPINDLE 10.1.3 Automatic Setting of Standard Parameters The standard parameters related to each motor model can be set automatically. * The specifications for controlling a motor depend on the specifications defined by the machine tool builder. The parameters defined by the machin
- Page 58410.AC SPINDLE B-63945EN/02 Code Motor model Amplifier 328 α22/7000HVi (1500/7000min-1) SPM-30HVi 329 α30/6000HVi (1150/6000min-1) SPM-45HVi 401 α6/12000i (1500/12000, 4000/12000min-1) SPM-11i 402 α8/10000i (1500/10000, 4000/10000min-1) SPM-11i 403 α12/10000i (1500/10000, 4000/10000min-1) SPM-15i 404
- Page 585B-63945EN/02 10.AC SPINDLE 10.1.4 Warning Interface Overview The warning state can be reported before an alarm is issued. When the warning state is entered, a report to the PMC is sent. For example, this signal can be used for retracting tools or reducing cutting load from the time a warning occurs
- Page 58610.AC SPINDLE B-63945EN/02 Warning Contents Details number 113 Converter radiator If the PSM radiator cooling fan stops, the warning cooling fan stopped signal is output. Since the spindle continues to operate at this time, use the PMC to perform processing as needed. If the PSM main circuit overhea
- Page 587B-63945EN/02 10.AC SPINDLE 10.1.5 Spindle Information Screen Overview In the αi spindle system, ID information output from each of the connected units is obtained and output to the CNC screen. The units that have ID information are shown below. (Remark: Some instances of these units do not have ID i
- Page 58810.AC SPINDLE B-63945EN/02 Displaying the spindle information screen 1 Press the SYSTEM function key, then press the [SYSTEM] soft key. 2 Press the [SPINDLE INFO] soft key to display the screen as shown below. * Spindle information is stored in flash ROM. If there is a difference between the ID info
- Page 589B-63945EN/02 10.AC SPINDLE - Spindle switch control When spindle switch control is used, the ID information of the subspindle is also displayed. Additional Information Even if replacement is performed reasonably such as for repairing, this function incorrectly indicates the * mark when it detects th
- Page 59010.AC SPINDLE B-63945EN/02 Editing the spindle information screen 1 Assume that parameter No.13112#0(IDW) = 1. 2 Press the MDI switch on the machine operator's panel. 3 Follow the steps shown in "Displaying the spindle information screen" to display the screen as shown below. PAGE 4 To move key-in b
- Page 591B-63945EN/02 10.AC SPINDLE Screen operation on the editing screen Mode Key operation Use Viewing Page key Scrolls up or down on a screen-by-screen (*1) basis. Editing (*2) Soft key [INPUT] Replace the selected ID information at the cursor position with the character string in key-in buffer. [CANCEL]
- Page 59211.TROUBLESHOOTING B-63945EN/02 11 TROUBLESHOOTING This chapter describes troubleshooting procedure. 11.1 CORRECTIVE ACTION FOR FAILURES ............................565 11.2 NO MANUAL OPERATION NOR AUTOMATIC OPERATION CAN BE EXECUTED ....................................567 11.3 JOG OPERATION CANNOT
- Page 593B-63945EN/02 11.TROUBLESHOOTING 11.1 CORRECTIVE ACTION FOR FAILURES When a failure occurs, it is important to correctly grasp what kind of failure occurred and take appropriate action, to promptly recover the machine. Check for the failure according to the following procedure : When? With what opera
- Page 59411.TROUBLESHOOTING B-63945EN/02 (1) Occurred at both low feedrate and high feedrate ? (2) Occurred only for a certain axis ? - For a failure related to spindles When did the failure occur ? (during power-on, acceleration, deceleration, or constant rotation) 3 What failure occurred ? - Which alarm wa
- Page 595B-63945EN/02 11.TROUBLESHOOTING 11.2 NO MANUAL OPERATION NOR AUTOMATIC OPERATION CAN BE EXECUTED Points (1) Execute the following procedure when no manual nor automatic operation is done (2) Check whether position display shows correct position (3) Check CNC status display (4) Check CNC internal sta
- Page 59611.TROUBLESHOOTING B-63945EN/02 (c) Confirm the status of modes Operation mode status is displayed on the lower part of screen as follows : If nothing is displayed, mode select signal is not input. Check mode select signal using PMC's diagnosis function (PMCDGN). For details, refer to section 1.9 CN
- Page 597B-63945EN/02 11.TROUBLESHOOTING (i) Check the parameters according to the parameter list. 1825 Servo loop gain per axis (Normal : 3000) (ii) Servo system may be abnormal. Refer to servo alarm SV0400, SV0410, and SV0411. (b) Jog feedrate override is 0% Check the signals using the PMC's signal status
- Page 59811.TROUBLESHOOTING B-63945EN/02 (d) The NC is in the reset state. In this state, "RESET" is display as the state indication of the previous item 1-(1)-(b). So, not only manual operation but also all automatic operations are disabled. So, referring to the item "Manual and automatic operations are dis
- Page 599B-63945EN/02 11.TROUBLESHOOTING 11.3 JOG OPERATION CANNOT BE DONE Points (1) Check whether position display is operating. (2) Check CNC status display. (3) Check internal status using Diagnostic function. Causes and Countermeasures 1 Position display (relative, absolute, machine coordinate) does not
- Page 60011.TROUBLESHOOTING B-63945EN/02 Example) In the normal state, pressing the "+X" button on the operator's panel causes the signal +Jn to be displayed as "1". * This signal becomes effective when the rise of the signal is detected. If, therefore, the direction selection signal has been entered before
- Page 601B-63945EN/02 11.TROUBLESHOOTING (b) Jog feedrate override is 0% Check the signals using the PMC's signal status screen. #7 #6 #5 #4 #3 #2 #1 #0 G0010 *JV7 *JV6 *JV5 *JV4 *JV3 *JV2 *JV1 *JV0 G0011 *JV15 *JV14 *JV13 *JV12 *JV11 *JV10 *JV9 *JV8 When the override is 0% all bits of the above address beco
- Page 60211.TROUBLESHOOTING B-63945EN/02 (4) Jog feed rate setting (Parameter) is not correct. 1423 Jog feedrate per axis (5) Manual feed per revolution is selected This function feeds an axis synchronized with spindle rotation and whether this function is used or not is selected by the following parameter:
- Page 603B-63945EN/02 11.TROUBLESHOOTING 11.4 HANDLE OPERATION CANNOT BE DONE Points If manual handle operation cannot be performed, the probable causes include the following: • The servo is not activated. • Manual pulse generators are not connected properly to the I/O module. • The I/O link of the I/O modul
- Page 60411.TROUBLESHOOTING B-63945EN/02 (2) Manual pulse generator failures When rotated, a manual pulse generator generates the signals shown below. Using an oscilloscope, measure the signals from the screw terminal block located at the rear of a manual pulse generator. If no signals are output, measure th
- Page 605B-63945EN/02 11.TROUBLESHOOTING 3 Checking the parameters and input signals See Section “CNC STATE DISPLAY.” (1) Check CNC status display at lower left corner of the screen. When the status display shows HND, mode selection is correct. If it is not HND, mode select signal is not input correctly. Che
- Page 60611.TROUBLESHOOTING B-63945EN/02 Selected axis HSnE HSnD HSnC HSnB HSnA 21st axis 1 0 1 0 1 22nd axis 1 0 1 1 0 23rd axis 1 0 1 1 1 24th axis 1 1 0 0 0 NOTE In the above table, n is the number of the manual pulse generator (MPG) and up to 3 MPGs can be used. A feed axis is selected by 4-bit code of A
- Page 607B-63945EN/02 11.TROUBLESHOOTING (a) In-position check is being done It shows that positioning is not yet completed. Check the contents of the following diagnosis number. (It is 1 in the following condition) DGN0300 Position Error>Parameter No.1826 In-position width (i) Check the parameters according
- Page 60811.TROUBLESHOOTING B-63945EN/02 11.5 AUTOMATIC OPERATION CANNOT BE DONE Points (1) Check manual operation is possible. (2) Check the status of cycle start LED on machine operator's manual. (3) Check status of CNC. Causes and Countermeasures When manual operation is either impossible, perform counter
- Page 609B-63945EN/02 11.TROUBLESHOOTING Check the state of this signal using the PMC's diagnosis function (PMCDGN). #7 #6 #5 #4 #3 #2 #1 #0 G0008 *SP *SP : Feed hold signal 2 When an automatic operation is in progress (Cycle start LED is lit) CNC's status display shows "STRT" on the screen. (1) Check the co
- Page 61011.TROUBLESHOOTING B-63945EN/02 *FVn : Feedrate override <2nd override signal (option)> Feed rate is overridden more finely using the signals below: See MTB's manual whether this feature is equipped. #7 #6 #5 #4 #3 #2 #1 #0 G0013 *AFV7 *AFV6 *AFV5 *AFV4 *AFV3 *AFV2 *AFV1 *AFV0 *AFVn : 2nd feed rate
- Page 611B-63945EN/02 11.TROUBLESHOOTING * This function is valid when CNC parameter RMBx (No.1005#7)=1. For whether this function is running or not, confirm the following signal using the PMC's signal status screen. Check the axis concerned. 1) The control axis detach signal (DTCHn) is input. #7 #6 #5 #4 #3
- Page 61211.TROUBLESHOOTING B-63945EN/02 G0011 *JV15 *JV14 *JV13 *JV12 *JV11 *JV10 *JV9 *JV8 When override value is 0%, all bits of the above address is [1111 . . . . 1111] or [0000 . . . . 0000]. *JV15 . . . . . . . . . . . . . . . . *JV0 Override 1111 1111 1111 1111 0.00% 1111 1111 1111 1110 0.01% : : 1101
- Page 613B-63945EN/02 11.TROUBLESHOOTING The following failure is considered: - Timing belt is broken - Key is removed - Coupling is loose - Connector of signal cable is loosened (ii) Position coder is faulty (c) Thread cutting does not operate (i) Position coder does not rotate Check the connection between
- Page 61411.TROUBLESHOOTING B-63945EN/02 11.6 CYCLE START LED SIGNAL HAS TURNED OFF Points (1) After cycle operation is started, then stopped, check as follows: (2) Confirm cycle start LED on machine operator's panel. (3) Confirm CNC's diagnosis function. Causes and Countermeasures The reason why cycle start
- Page 615B-63945EN/02 11.TROUBLESHOOTING d. Reset & rewind signal is input #7 #6 #5 #4 #3 #2 #1 #0 G0008 RRW #6(RRW) : When this signal is 1, the reset & rewind signal is input. * This signal is usually used for a confirmation signal of M30 when an M30 is specified in a program as the end of a program. There
- Page 61611.TROUBLESHOOTING B-63945EN/02 11.7 NOTHING IS DISPLAYED ON THE LCD WHEN THE POWER IS TURNED ON Causes and Countermeasures If nothing is displayed on the LCD at power-up or if the LCD is locked with "LOADING GRAPHIC SYSTEM", the probable causes include the following: - For the LCD-mounted type - Th
- Page 617B-63945EN/02 11.TROUBLESHOOTING - Defective printed circuit board If the main board or display control card is defective or is not correctly installed, the CNC may not start up. Check that the card PCBs are engaged firmly with the connectors on the motherboard. If any of the above actions does not s
- Page 61811.TROUBLESHOOTING B-63945EN/02 11.8 INPUT FROM AND OUTPUT TO I/O DEVICES CANNOT BE PERFORMED INPUT/OUTPUT CANNOT BE PERFORMED PROPERLY Causes and Countermeasures If the I/O Link is not established, if the signals from an I/O device cannot be input normally to the CNC, or if the signals from the CNC
- Page 619B-63945EN/02 11.TROUBLESHOOTING Screen display example This example indicates that the I/O Link is as shown in the figure below. I/O module for Control unit connector panel JD51A Group 0 Operator's panel I/O module Group 1 - Checking the power supplies of the I/O devices Check that the connected I/O
- Page 62011.TROUBLESHOOTING B-63945EN/02 - Connection of cables As in the example shown on the previous page, I/O Link cables are used to connect JD1A (JD51A) and JD1Bs. JD1A (JD51A) represents an upper unit while JD1B represents a lower unit. Check that the cables are connected correctly. - Connection of gr
- Page 621B-63945EN/02 11.TROUBLESHOOTING 11.9 IN A CONNECTOR PANEL I/O UNIT, DATA IS INPUT TO AN UNEXPECTED ADDRESS If data is input to an invalid address in a connector panel I/O unit (for example, data that should be input to X004 is actually input to X010 in a connector panel I/O unit), the most likely ca
- Page 62211.TROUBLESHOOTING B-63945EN/02 11.10 IN A CONNECTOR PANEL I/O UNIT, NO DATA IS OUTPUT TO AN EXPANSION UNIT The most likely cause is that power is not being supplied to the expansion unit. → Check whether +24-V power is supplied to No. 18 pin and No. 50 pin of the expansion unit, DI and DO signals a
- Page 623B-63945EN/02 11.TROUBLESHOOTING 11.11 ALARM SR0085 TO SR0087 (READER/PUNCHER INTERFACE ALARM) START YES Alarm SR0085? NO - Check baud rate and other I/O parameters YES - I/O device is faulty Alarm SR0086? NO NO Is I/O parameter correct? YES - Reset the parameter according to the item of data I/O. OF
- Page 62411.TROUBLESHOOTING B-63945EN/02 Countermeasures (a) Parameters on reader/puncher interface are not correct. Check the following setting data and parameters: - Setting PUNCH CODE=0 OR 1 (0: EIA,1:ISO) Select ISO or EIA according to the type of I/O device. If punch code does not match, alarm SR0086 wi
- Page 625B-63945EN/02 11.TROUBLESHOOTING 0102 Type of I/O device 0112 0122 Value TYPE OF I/O DEVICE 0 RS–232–C (Used control codes DC1 to DC4) 1 FANUC CASSETTE ADAPTOR 1 (FANUC CASSETTE B1/ 1 B2) 2 2 FANUC CASSETTE ADAPTOR 3 (FANUC CASSETTE F1) FANUC PROGRAM FILE Mate, FANUC FA CARD ADAPTOR 3 FANUC FLOPPY CA
- Page 62611.TROUBLESHOOTING B-63945EN/02 - Connection Main board RS232C (JD56A) Punch panel RS232C (JD36A) Such as I/O device - Cable connection RS232C (JD56A) (JD36A) Punch panel RD (01) (03) RD 0V (02) DR (03) (06) DR 0V (04) CS (05) (05) CS 0V (06) CD (07) (08) CD 0V (08) (09) +24V (10) SD (11) (02) SD 0V
- Page 627B-63945EN/02 11.TROUBLESHOOTING 11.12 ALARM PS0090 (REFERENCE POSITION RETURN IS ABNORMAL) Contents Reference position return was executed when the following condition is not satisfied: The CNC received one rotation signal at least one time when the axis is moving to the reference position at a spee
- Page 62811.TROUBLESHOOTING B-63945EN/02 (1) Check whether the motor rotated more than one rotation (one rotation signal is issued ) at faster than 128 pulses of position error amount. NO Return start position is too close Rotated ? - Change the return start position. - Move the machine at faster that 128 YE
- Page 629B-63945EN/02 11.TROUBLESHOOTING 11.13 ALARM DS0300 (REQUEST FOR REFERENCE POSITION RETURN) Absolute position data in the serial Pulsecoder was lost. (This alarm will be generated when serial Pulsecoder is exchanged or position feedback signal cable of the serial Pulsecoder is disconnected). Counterm
- Page 63011.TROUBLESHOOTING B-63945EN/02 11.14 ALARM SV0401 (V READY OFF) Causes and Countermeasures This alarm is issued if the servo ready signal (VRDY) of a servo amplifier does not turn on or if the signal turns off during operation. There are cases in which this alarm is issued because another servo ala
- Page 631B-63945EN/02 11.TROUBLESHOOTING Check items - Is the PSM control power supply on? - Has an emergency stop been canceled? - Is a terminating connector connected to the JX1B connector of the terminating amplifier? - Is MCC on? If there is an external MCC sequence in addition to the MCC contact of the
- Page 63211.TROUBLESHOOTING B-63945EN/02 11.15 ALARM SV0404 (V READY ON) Causes and Countermeasures This alarm is issued if the servo ready signal (VRDY) of a servo amplifier remains on. The servo amplifier or the axis control cards on the CNC may be defective. - VRDY CNC Servo amplifier MCON: From the CNC t
- Page 633B-63945EN/02 11.TROUBLESHOOTING 11.16 ALARM SV0462 (SEND CNC DATA FAILED) ALARM SV0463 (SEND SLAVE DATA FAILED) Causes and Countermeasures Alarm SV0462 is issued if a slave (servo amplifier) cannot receive correct data due to an FSSB communication error. Alarm SV0463 is issued if the CNC cannot rece
- Page 63411.TROUBLESHOOTING B-63945EN/02 11.17 ALARM SV0417 (DIGITAL SERVO SYSTEM IS ABNORMAL) Digital servo parameters are abnormal. (Digital servo parameters are set incorrectly.) Causes 1 Confirm the setting value of the following parameters: Parameter No. 2020 : Motor format number Parameter No. 2022 : M
- Page 635B-63945EN/02 11.TROUBLESHOOTING 11.18 ALARM OH0700 (OVERHEAT: CONTROL UNIT) Causes and Countermeasures This alarm is issued if the ambient temperature of the CNC control unit is abnormally high. As an installation condition, the ambient temperature of the CNC must not exceed 58°C (for LCD-mounted ty
- Page 63611.TROUBLESHOOTING B-63945EN/02 11.19 ALARM OH0701 (OVERHEAT: FAN MOTOR) Causes and Countermeasures This alarm is issued if a fault occurs in any of the fan motors, such as the stoppage of a fan motor during the operation of the CNC. - Fan motors Fan motors are installed in the uppermost portion of
- Page 637B-63945EN/02 11.TROUBLESHOOTING 11.20 ALARM SV5134 (FSSB: OPEN READY TIME OUT) ALARM SV5137 (FSSB: CONFIGURATION ERROR) ALARM SV5197 (FSSB: OPEN TIME OUT) Causes and Countermeasures These alarms are issued due to a failure in the optical cable, axis control card, or a slave such as a servo amplifier
- Page 63811.TROUBLESHOOTING B-63945EN/02 11.21 ALARM SV5136 (FSSB: NUMBER OF AMPS IS SMALL) Causes and Countermeasures The number of servo amplifiers recognized by the FSSB is insufficient, compared with the number of controlled axes. - FSSB setting screen If this alarm is issued, display the amplifier setti
- Page 639B-63945EN/02 11.TROUBLESHOOTING 11.22 SERVO ALARMS For an explanation of the following servo alarms, refer to the FANUC SERVO MOTOR αi series Maintenance Manual (B-65285EN). Number Message Contents SV0417 ILL DGTL SERVO PARAMETER A digital serve parameter setting is incorrect. SV0420 SYNC TORQUE EXC
- Page 64011.TROUBLESHOOTING B-63945EN/02 Number Message Contents SV0446 HARD DISCONNECT ALARM The hardware detected a disconnected built–in Pulsecoder. SV0447 HARD DISCONNECT(EXT) The hardware detected a disconnected separate detector. SV0448 UNMATCHED FEEDBACK ALARM The sign of the feedback signal from the
- Page 641B-63945EN/02 11.TROUBLESHOOTING Number Message Contents SV0603 INV. IPM ALARM(OH) SVM : The IPM (Intelligent Power Module) detected an overheat alarm. β SVU : The IPM (Intelligent Power Module) detected an overheat alarm. SV0604 AMP. COMMUNICATION ERROR The communication between SVM and PSM is in er
- Page 64211.TROUBLESHOOTING B-63945EN/02 11.23 SPC ALARMS For an explanation of the following SPC alarms (serial Pulsecoder alarms), refer to the FANUC SERVO MOTOR αi series Maintenance Manual (B-65285EN). Number Message Contents SV0360 ABNORMAL CHECKSUM (INT) A checksum error occurred in the built-in Pulsec
- Page 643B-63945EN/02 11.TROUBLESHOOTING 11.24 SPINDLE ALARMS For an explanation of the following spindle alarms, refer to the FANUC SERVO MOTOR αi series Maintenance Manual (B-65285EN). Number Contents SP9001 to later: Spindle_n n-th spindle alarm (SPM display 01 or larger) - 615 -
- Page 64411.TROUBLESHOOTING B-63945EN/02 11.25 SYSTEM ALARMS 11.25.1 Overview The FANUC 30i series makes a transition to the special processing state called the system alarm state when a state that disables the continuation of normal system operation is detected. When the system alarm state is entered, the C
- Page 645B-63945EN/02 11.TROUBLESHOOTING - Hardware causes Mainly, hardware detects hardware errors. Typical causes are as follows: • Parity error (DRAM, SRAM, cache) • Bus error • Power supply alarm • FSSB cable disconnection - Others Moreover, system alarms are caused by the following: • Causes detected by
- Page 64611.TROUBLESHOOTING B-63945EN/02 11.25.2 Operations on the System Alarm Screen Description of system alarm screen When a system alarm is issued, the screen display is switched to a screen as shown below. This screen is referred to as the system alarm screen. The system alarm screen consists of severa
- Page 647B-63945EN/02 11.TROUBLESHOOTING Output of system alarm information With the FANUC Series 30i /31i /32i, saved system alarm information can be output from the IPL screen to the memory card. (When using the FANUC Series FANUC Series 300i /310i /320i /300is /310is /320is, use the SRAM batch save functi
- Page 64811.TROUBLESHOOTING B-63945EN/02 4. If the IPL monitor is executed on the system alarm screen, enter 2 to select "2. OUTPUT SYSTEM ALARM FILE FROM DRAM". If the power is turned off, enter 1 to select "1. OUTPUT SYSTEM ALARM FILE FROM FILE-RAM". 5. If 1 is selected in step 4, a list of saved system al
- Page 649B-63945EN/02 11.TROUBLESHOOTING 11.25.3 System Alarms Detected by Hardware System alarm 400 and subsequent system alarms indicate errors detected by hardware. The basic screen configuration is shown below: ① SERIES 30I G001Z ② SYS_ALM401 EXTERNAL BUS INVALID ADDRESS ③ MAIN BOARD ④ 2003/04/22 17:09:5
- Page 65011.TROUBLESHOOTING B-63945EN/02 11.25.4 System Alarm 401 (EXTERNAL BUS INVALID ADDRESS) SERIES 30I G001Z SYS_ALM401 EXTERNAL BUS INVALID ADDRESS MAIN BOARD 2004/04/21 20:34:16 PROGRAM COUNTER : 1000B52CH ACT TASK : 01000010H ACCESS ADDRESS : - ACCESS DATA : - ACCESS OPERATION : - BUS MASTER PCB : MA
- Page 651B-63945EN/02 11.TROUBLESHOOTING 11.25.5 System Alarm 404 (S-BUS TIME OUT ERROR) SERIES 30I G001Z SYS_ALM441 S-BUS TIME OUT ERROR MAIN BOARD 2004/04/21 21:24:12 PROGRAM COUNTER : 102FD028H ACT TASK : 01000010H ACCESS ADDRESS : - ACCESS DATA : - ACCESS OPERATION : - BUS MASTER PCB : CPU CARD +--+-----
- Page 65211.TROUBLESHOOTING B-63945EN/02 11.25.6 System Alarm 404 (ECC UNCORRECTABLE ERROR) SERIES 30I G001Z SYS_ALM404 ECC UNCORRECTABLE ERROR CPU CARD 2003/04/22 17:09:53 PROGRAM COUNTER : 100DB2E0H ACT TASK : 0100FFFBH ACCESS ADDRESS : - ACCESS DATA : - ACCESS OPERATION : - BUS MASTER PCB : MAIN BOARD +--
- Page 653B-63945EN/02 11.TROUBLESHOOTING 11.25.7 System Alarm 500 (SRAM DATA ERROR(SRAM MODULE)) SERIES 30I G001Z SYS_ALM500 SRAM DATA ERROR(SRAM MODULE) FROM/SRAM MODULE 2004/04/21 21:26:52 PROGRAM COUNTER : 1000C0C4H ACT TASK : 30000001H ACCESS ADDRESS : - ACCESS DATA : - ACCESS OPERATION : - BUS MASTER PC
- Page 65411.TROUBLESHOOTING B-63945EN/02 11.25.8 System Alarm 502 (NOISE ON POWER SUPLY) SERIES 30I G001Z SYS_ALM502 NOISE ON POWER SUPLY POWER SUPPLY MODULE 2004/04/21 21:26:52 PROGRAM COUNTER : 1000C0C4H ACT TASK : 30000001H ACCESS ADDRESS : - ACCESS DATA : - ACCESS OPERATION : - BUS MASTER PCB : MAIN BOAR
- Page 655B-63945EN/02 11.TROUBLESHOOTING 11.25.9 System Alarm 503 (NOISE ON POWER SUPLY) SERIES 30I G001Z SYS_ALM503 NOISE ON POWER SUPLY ABNORMAL POWER SUPPLY(MAIN BOARD) 2004/04/21 21:26:52 PROGRAM COUNTER : 1000C0C4H ACT TASK : 30000001H ACCESS ADDRESS : - ACCESS DATA : - ACCESS OPERATION : - BUS MASTER P
- Page 65611.TROUBLESHOOTING B-63945EN/02 11.25.10 System Alarms 114 to 130 (Alarms on the FSSB) Causes An alarm was detected on the FSSB. NOTE ”/LINEx” following a message if displayed indicates the number of an optical connector on an axis control card. LINE1 : COP10A-1 on the servo card LINE2 : COP10A-2 on
- Page 657B-63945EN/02 11.TROUBLESHOOTING SYS_ALM126 FSSB INTERNAL DISCONNECTION 126: Internal communication in the nth servo amplifier (AMPn) -> /LINEx failed. SYS_ALM127 FSSB INTERNAL DISCONNECTION 127: Internal communication in the nth servo amplifier (AMPn) <- /LINEx failed. Replace the relevant servo amp
- Page 65811.TROUBLESHOOTING B-63945EN/02 11.26 SYSTEM ALARMS RELATED TO THE PMC AND I/O LINK SYS_ALM197 EMBEDDED SOFTWARE SYSTEM ERROR …. EMBEDDED SOFTWARE SYSTEM ERROR:(406N-0010) PCxxx xxxxxxxxxxxxxxxxxxxxxxxxxx (Alarm No.) When an alarm message as shown above is displayed, a system alarm related to the PM
- Page 659B-63945EN/02 11.TROUBLESHOOTING Alarm number Contents Faulty location/corrective action PC060 BUS xxxxxxxx:yyyyyyyy A bus error occurred in the PMC <1> When you use a I/O Unit-Model A, no system. base extension unit is connected corresponding to a I/O assignment data. Check connection of I/O devices
- Page 66011.TROUBLESHOOTING B-63945EN/02 Alarm number Contents Faulty location/corrective action PC501 NC/PMC INTERFACE ERR The read or write operation Contact us with information on the PATHn between CNC and PMC failed. circumstances under which the alarm occurred (displayed message, system configuration, o
- Page 661APPENDI
- Page 662
- Page 663B-63945EN/02 APPENDIX A.ALARM LIST A ALARM LIST A.1 ALARM LIST (CNC)...............................................................636 A.2 ALARM LIST (PMC) ..............................................................684 A.3 ALARM LIST (SERIAL SPINDLE) .......................................704 A.4
- Page 664A.ALARM LIST APPENDIX B-63945EN/02 A.1 ALARM LIST (CNC) (1) Alarms on program and operation (PS alarm) (2) Background edit alarms (BG alarm) (3) Communication alarms (SR alarm) Alarm numbers are common to all these alarm types. Depending on the state, an alarm is displayed as in the following exampl
- Page 665B-63945EN/02 APPENDIX A.ALARM LIST Number Message Description 0020 OVER TOLERANCE OF RADIUS An arc was specified for which the difference in the radius at the start and end points exceeds the value set in parameter No. 2410. Check arc center codes I, J and K in the program. The tool path when parame
- Page 666A.ALARM LIST APPENDIX B-63945EN/02 Number Message Description 0035 CAN NOT COMMANDED G31 - G31 cannot be specified. This alarm is generated when a G code (such as for cutter or tool-nose radius compensation) of group 07 is not canceled. - A torque limit skip was not specified in a torque limit skip
- Page 667B-63945EN/02 APPENDIX A.ALARM LIST Number Message Description 0053 TOO MANY ADDRESS COMMANDS In the chamfering and corner R commands, two or more of I, J, K and R are specified. 0054 NO TAPER ALLOWED AFTER A block in which chamfering in the specified angle or the corner CHF/CNR R was specified inclu
- Page 668A.ALARM LIST APPENDIX B-63945EN/02 Number Message Description 0071 DATA NOT FOUND - The address to be searched was not found. - The program with specified program number was not found in program number search. - In the program restart block number specification, the specified block number could not
- Page 669B-63945EN/02 APPENDIX A.ALARM LIST Number Message Description 0081 G37 OFFSET NO. UNASSIGNED - For machining center series The tool length measurement function (G37) is specified without specifying an H code. Correct the program. - For lathe The automatic tool compensation function (G36, G37) is spe
- Page 670A.ALARM LIST APPENDIX B-63945EN/02 Number Message Description 0094 P TYPE NOT ALLOWED (COORD P type cannot be specified when the program is restarted. (After CHG) the automatic operation was interrupted, the coordinate system setting operation was performed.) Perform the correct operation according
- Page 671B-63945EN/02 APPENDIX A.ALARM LIST Number Message Description 0125 MACRO STATEMENT FORMAT The format used in a macro statement in a custom macro is in ERROR error. 0126 ILLEGAL LOOP NUMBER DO and END Nos. in a custom macro are in error, or exceed the permissible range (valid range: 1 to 3). 0127 DUP
- Page 672A.ALARM LIST APPENDIX B-63945EN/02 Number Message Description 0148 SETTING ERROR Automatic corner override deceleration rate is out of the settable range of judgement angle. Modify the parameters (No.1710 to No.1714). 0154 NOT USING TOOL IN LIFE GROUP H99 or D99 is specified when no tool management
- Page 673B-63945EN/02 APPENDIX A.ALARM LIST Number Message Description 0194 SPINDLE COMMAND IN A Cs contour control mode, spindle positioning command, or SYNCHRO-MODE rigid tapping mode was specified during the spindle synchronous control mode or simple spindle synchronous control mode. 0197 C-AXIS COMMANDED
- Page 674A.ALARM LIST APPENDIX B-63945EN/02 Number Message Description 0218 NOT FOUND P/Q COMMAND P or Q is not commanded in the G51.2 block, or the command value is out of the range. Modify the program. For a polygon turning between spindles, more information as to why this alarm occurred is indicated in DG
- Page 675B-63945EN/02 APPENDIX A.ALARM LIST Number Message Description 0300 ILLEGAL COMMAND IN SCALING An illegal G code was specified during scaling. Modify the program. For the T system, one of the following functions is specified during scaling, this alarm is generated. - finishing cycle (G70 or G72) - ou
- Page 676A.ALARM LIST APPENDIX B-63945EN/02 Number Message Description 0310 FILE NOT FOUND The specified file could not be found during a subprogram or macro call. 0311 CALLED BY FILE NAME FORMAT An invalid format was specified to call a subprogram or macro ERROR using a file name. 0312 ILLEGAL COMMAND IN DI
- Page 677B-63945EN/02 APPENDIX A.ALARM LIST Number Message Description 0325 UNAVAILABLE COMMAND IS IN An usable command was issued in a shape program for a SHAPE PROGRAM multiple repetitive canned cycle (G70, G71, G72, or G73). 0326 LAST BLOCK OF SHAPE PROGRAM In a shape program in the multiple repetitive ca
- Page 678A.ALARM LIST APPENDIX B-63945EN/02 Number Message Description 0348 TOOL CHANGE Z AXIS POS NOT A tool change spindle on the Z-axis is not set. ESTABLISHED 0349 TOOL CHANGE SPINDLE NOT STOP A tool change spindle stop is not stopped. 0350 PARAMETER OF THE INDEX OF An illegal synchronization control axi
- Page 679B-63945EN/02 APPENDIX A.ALARM LIST Number Message Description 0362 SUPERPOSITION CONTROL AXIS This error occurred when: COMPOSITION ERROR. 1) An attempt was made to perform superposition control for the axis during a synchronization, composition, or superposition. 2) An attempt was made to synchroni
- Page 680A.ALARM LIST APPENDIX B-63945EN/02 Number Message Description 0374 ILLEGAL REGISTRATION OF TOOL G10L75 or G10L76 data was registered during the following MANAGER(G10) data registration: - From the PMC window. - From the FOCAS2. - By G10L75 or G10L76 in another system. Command G10L75 or G10L76 again
- Page 681B-63945EN/02 APPENDIX A.ALARM LIST Number Message Description 0404 RTM ERROR An error related to a real time macro command occurred. 0406 CODE AREA SHORTAGE The storage size of the real time macro area is insufficient. 0407 DOULE SLASH IN RTM MODE In the compile mode, an attempt was made to set the
- Page 682A.ALARM LIST APPENDIX B-63945EN/02 Number Message Description 1091 DUPLICATE SUB-CALL WORD More than one subprogram call instruction was specified in the same block. 1092 DUPLICATE MACRO-CALL WORD More than one macro call instruction was specified in the same block. 1093 DUPLICATE NC-WORD & M99 An a
- Page 683B-63945EN/02 APPENDIX A.ALARM LIST Number Message Description 1141 ILLEGAL CHARACTER IN VAR. The SETVN statement in a custom macro contacts a character NAME that cannot be used in a variable name. 1142 TOO LONG V-NAME (SETVN) The variable name used in a SETVN statement in a custom macro exceeds 8 ch
- Page 684A.ALARM LIST APPENDIX B-63945EN/02 Number Message Description 1298 ILLEGAL INCH/METRIC An error occurred during inch/metric switching. CONVERSION 1300 ILLEGAL ADDRESS The axis No. address was specified even though the parameter is not an axis–type while loading parameters or pitch error compensation
- Page 685B-63945EN/02 APPENDIX A.ALARM LIST Number Message Description 1360 PARAMETER OUT OF RANGE Illegal parameter setting. (Set value is out of range.) (TLAC) 1361 PARAMTER SETTING ERROR 1 Illegal parameter setting. (axis of rotation setting) (TLAC) 1362 PARAMETER SETTING ERROR 2 Illegal parameter setting
- Page 686A.ALARM LIST APPENDIX B-63945EN/02 Number Message Description 1541 S-CODE ZERO “0” has been instructed as the S code. 1542 FEED ZERO (E-CODE) “0” has been instructed as the feedrate (E code). 1543 ILLEGAL GEAR SETTING The gear ratio between the spindle and position coder, or the set position coder n
- Page 687B-63945EN/02 APPENDIX A.ALARM LIST Number Message Description 1593 EGB PARAMETER SETTING ERROR Error in setting a parameter related to the EGB (1) The setting of SYN, bit 0 of parameter No. 2011, is not correct. (2) The slave axis specified with G81 is not set as a rotation axis. (ROT, bit 0 of para
- Page 688A.ALARM LIST APPENDIX B-63945EN/02 Number Message Description 1807 PARAMETER SETTING ERROR An I/O interface option that has not yet been added on was specified. The external I/O device and baud rate, stop bit and protocol selection settings are erroneous. 1808 DEVICE DOUBLE OPENED An attempt was mad
- Page 689B-63945EN/02 APPENDIX A.ALARM LIST Number Message Description 1995 ILLEGAL PARAMETER IN The parameter settings (parameter Nos. 6080 to 6089) for G41.2/G42.2 determining the relationship between the axis of rotation and the rotation plane are incorrect. 1999 ILLEGAL PARAMETER IN G41.3 The parameter s
- Page 690A.ALARM LIST APPENDIX B-63945EN/02 Number Message Description 5010 END OF RECORD The EOR (End of Record) code is specified in the middle of a block. This alarm is also generated when the percentage at the end of the NC program is read. 5011 PARAMETER ZERO (CUT MAX) The maximum cutting feedrate param
- Page 691B-63945EN/02 APPENDIX A.ALARM LIST Number Message Description 5058 G35/G36 FORMAT ERROR A command for switching the major axis has been specified for circular threading. Alternatively, a command for setting the length of the major axis to 0 has been specified for circular threading. 5060 ILLEGAL PAR
- Page 692A.ALARM LIST APPENDIX B-63945EN/02 Number Message Description 5122 ILLEGAL COMMAND IN SPIRAL A spiral interpolation or conical interpolation command has an error. Specifically, this error is caused by one of the following: 1) L = 0 is specified. 2) Q = 0 is specified. 3) R/, R/, C is specified. 4) Z
- Page 693B-63945EN/02 APPENDIX A.ALARM LIST Number Message Description 5305 ILLEGAL SPINDLE NUMBER In a spindle select function by address P for a multiple spindle control, 1) Address P is not specified. 2) Parameter No.3781 is not specified to the spindle to be selected. 3) An illegal G code which cannot be
- Page 694A.ALARM LIST APPENDIX B-63945EN/02 Number Message Description 5421 ILLEGAL COMMAND IN G43.4/G43.5 An illegal command was specified in tool center point control. - A rotation axis command was specified in tool center point control (type 2) mode. - With a table rotary type or mixed-type machine, a I,J
- Page 695B-63945EN/02 APPENDIX A.ALARM LIST Number Message Description 5459 MACHINE PARAMETER INCORRECT - A machine configuration parameter (parameter No. 19665 to No.19667 or 19680 to 19714 or No.12321) is illegal. - The axis which is specified in parameter No.19681 or No.19686 is not a rotation axis. - The
- Page 696A.ALARM LIST APPENDIX B-63945EN/02 Number Message Description 5460 ILLEGAL USE OF TRC FOR 5-AXIS - In the cutter compensation mode for 5-axis machining (except MACHINE the tool side offset function for a tool rotation type machine), a move command other than G00/G01 is specified. - With a table rota
- Page 697B-63945EN/02 APPENDIX A.ALARM LIST (5) Servo alarms (SV alarm) Number Message Description SV0001 SYNC ALIGNMENT ERROR In feed axis synchronization control, the amount of compensation for synchronization exceeded the parameter (No. 8325) setting value. This alarm occurs only for a slave axis. SV0002
- Page 698A.ALARM LIST APPENDIX B-63945EN/02 Number Message Description SV0307 APC ALARM: MOVEMENT EXCESS Since the machine moved excessively, the correct machine ERROR position could not be obtained. SV0360 ABNORMAL CHECKSUM(INT) The checksum alarm occurred on the built–in Pulsecoder. SV0361 ABNORMAL PHASE D
- Page 699B-63945EN/02 APPENDIX A.ALARM LIST Number Message Description SV0413 LSI OVERFLOW The counter for the amount of positional deviation overflowed SV0415 MOTION VALUE OVERFLOW The velocity exceeding the travel velocity limit was commanded. SV0417 ILL DGTL SERVO PARAMETER A digital serve parameter setti
- Page 700A.ALARM LIST APPENDIX B-63945EN/02 Number Message Description SV0448 UNMATCHED FEEDBACK ALARM The sign of the feedback signal from the standalone detector is opposite to that from the feedback signal from the built–on Pulsecoder. SV0449 INV. IPM ALARM SVM : The IPM (Intelligent Power Module) detecte
- Page 701B-63945EN/02 APPENDIX A.ALARM LIST Number Message Description SV0604 AMP. COMMUNICATION ERROR The communication between SVM and PSM is in error. SV0605 CNV. EX. DISCHARGE POW. PSMR : The motor regenerative power is too much. SV0606 CNV. RADIATOR FAN FAILURE PSM : External radiator cooling fan failur
- Page 702A.ALARM LIST APPENDIX B-63945EN/02 (6) Overtravel alarms (OT alarm) Number Message Description OT0500 + OVERTRAVEL ( SOFT 1 ) Exceeded the positive side stored stroke check 1. OT0501 - OVERTRAVEL ( SOFT 1 ) Exceeded the negative side stored stroke check 1. OT0502 + OVERTRAVEL ( SOFT 2 ) Exceeded the
- Page 703B-63945EN/02 APPENDIX A.ALARM LIST (7) Memory file alarms (IO alarm) Number Message Description IO1001 FILE ACCESS ERROR The resident–type file system could not be accessed as an error occurred in the resident–type file system. IO1002 FILE SYSTEM ERROR The file could not be accessed as an error occu
- Page 704A.ALARM LIST APPENDIX B-63945EN/02 (8) Alarms requiring power to be turned off (PW alarm) Number Message Description PW0000 POWER MUST BE OFF A parameter was set for which the power must be turned OFF then ON again. PW0001 X-ADDRESS(*DEC) IS NOT ASSIGNED. The X address of the PMC could not be assign
- Page 705B-63945EN/02 APPENDIX A.ALARM LIST (9) Spindle alarms (SP alarm) Number Message Description SP0740 RIGID TAP ALARM : EXCESS ERROR The positional deviation of the stopped spindle has exceeded the set value during rigid tapping. SP0741 RIGID TAP ALARM : EXCESS ERROR The positional deviation of the mov
- Page 706A.ALARM LIST APPENDIX B-63945EN/02 Number Message Description SP1226 FRAMING ERROR (SERIAL SPINDLE) A framing error occurred in communications between the CNC and the serial spindle amplifier. SP1227 RECEIVING ERROR (SERIAL SPINDLE) A receive error occurred in communications between the CNC and the
- Page 707B-63945EN/02 APPENDIX A.ALARM LIST Number Message Description SP1996 ILLEGAL SPINDLE PARAMETER The spindle was assigned incorrectly. Check to see the SETTING following parameter. (No.3716 or 3717) SP1998 SPINDLE CONTROL ERROR An error occurred in the spindle control software. SP1999 SPINDLE CONTROL
- Page 708A.ALARM LIST APPENDIX B-63945EN/02 (11) Other alarms (DS alarm) Number Message Description DS0001 SYNC EXCESS ERROR (POS DEV) In feed axis synchronization control, the difference in the amount of positional deviation between the master and slave axes exceeded the parameter (No. 8323) setting value.
- Page 709B-63945EN/02 APPENDIX A.ALARM LIST Number Message Description DS0131 TOO MANY MESSAGE An attempt was made to display an external operator message or external alarm message, but five or more displays were required simultaneously. DS0132 MESSAGE NUMBER NOT FOUND An attempt to cancel an external operat
- Page 710A.ALARM LIST APPENDIX B-63945EN/02 Number Message Description DS1127 DI.EIDHW OUT OF RANGE The numerical value input by external data input signals EID32 to EID47 has exceeded the permissible range. DS1128 DI.EIDLL OUT OF RANGE The numerical value input by external data input signals EID0 to EID31 h
- Page 711B-63945EN/02 APPENDIX A.ALARM LIST Number Message Description DS1933 NEED REF RETURN(SYNC:MIX:OVL) The relation between a machine coordinate of an axis in synchronization, composition, or superposition control, and the absolute, or relative coordinate was displaced. Perform the manual return to the
- Page 712A.ALARM LIST APPENDIX B-63945EN/02 A.2 ALARM LIST (PMC) A.2.1 Messages That May Be Displayed on the PMC Alarm Screen The following table lists the PMC alarm messages that may be displayed on the PMC alarm screen. Alarm number Faulty location/corrective action Contents ER01 PROGRAM DATA ERROR <1> Ent
- Page 713B-63945EN/02 APPENDIX A.ALARM LIST Alarm number Faulty location/corrective action Contents ER21 MESSAGE DATA ERROR Display the MESSAGE DATA EDITOR A function key was pressed during screen again, and terminate the editing the editing of the message data, operation by pressing the [EXIT] soft key. cau
- Page 714A.ALARM LIST APPENDIX B-63945EN/02 Alarm number Faulty location/corrective action Contents ER51 PMC EXECUTION Check CNC parameter Nos. 11905 to The set execution percentage of the PERCENTAGE ERROR 11907. multi-PMC function is invalid. ER52 IOLINK CHANNEL Check CNC parameter Nos. 11910 to The I/O Lin
- Page 715B-63945EN/02 APPENDIX A.ALARM LIST A.2.2 PMC System Alarm Messages Alarm number Faulty location/corrective action Contents PC004 CPU ERR xxxxxxxx:yyyyyyyy This alarm may be due to a hardware A CPU error occurred in the PMC PC006 CPU ERR xxxxxxxx:yyyyyyyy fault; contact us with information on the sys
- Page 716A.ALARM LIST APPENDIX B-63945EN/02 Alarm number Faulty location/corrective action Contents PC090 NMI(___) xxxxxxxx:yyyyyyyy This alarm may be due to a hardware An NMI event occurred in the PMC fault; contact us with information on the control software for an unknown circumstances under which the ala
- Page 717B-63945EN/02 APPENDIX A.ALARM LIST A.2.3 Operation Errors Error messages that may be displayed on the PMC LADDER DIAGRAM VIEWER screen Alarm number Faulty location/corrective action Contents INPUT INVALID Input a valid address or numeric value. The input address or numeric value is invalid. PROGRAM
- Page 718A.ALARM LIST APPENDIX B-63945EN/02 Error messages that may be displayed on the PMC LADDER DIAGRAM EDITOR screen Alarm number Faulty location/corrective action Contents THIS NET IS PROTECTED When you are editing data on a per-subprogram basis, you cannot edit the subprogram frame nets (END1, END2, EN
- Page 719B-63945EN/02 APPENDIX A.ALARM LIST Error messages that may be displayed on the PMC LADDER DIAGRAM EDITOR screen (when updating) Alarm number Faulty location/corrective action Contents OVERLAPPED COM If COME is missing, add it in proper There is no COME that corresponds to position. If the COM is unn
- Page 720A.ALARM LIST APPENDIX B-63945EN/02 Alarm number Faulty location/corrective action Contents NO END Add END, END1, END2 or END3 in END, END1, END2 or END3 is not found. NO END1 proper position. NO END2 NO END3 DUPLICATE END1 Remove extra END1, END2 or END3. Multiple END1, END2 or END3 are found. DUPLI
- Page 721B-63945EN/02 APPENDIX A.ALARM LIST Alarm number Faulty location/corrective action Contents LBL FOR JMPC IN BAD LEVEL JMPC is used to jump from a Destination of JMPC is not level 2. subprogram to level 2. If the JMPC is unnecessary, remove it. If another LBL of same L-address that the JMPC is intende
- Page 722A.ALARM LIST APPENDIX B-63945EN/02 Alarm number Faulty location/corrective action Contents DUPLICATE TMR NUMBER If some of them are unnecessary, Plural TMRs have the same number as (WARNING) remove them. If all of them are their parameter. (This is warning.) necessary, assign other number to paramet
- Page 723B-63945EN/02 APPENDIX A.ALARM LIST Error messages that may be displayed on the PMC NET EDITOR screen Alarm number Faulty location/corrective action Contents ILLEGAL FUNCTIONAL Specify the name of an available The entered name of functional instruction INSTRUCTION NAME functional instruction. is inva
- Page 724A.ALARM LIST APPENDIX B-63945EN/02 Error messages that may be displayed on the TITLE DATA EDITOR screen Alarm number Faulty location/corrective action Contents TOO MANY CHARACTERS Make sure that the entered character The number of characters in the entered string is within the allowable input length
- Page 725B-63945EN/02 APPENDIX A.ALARM LIST Error messages that may be displayed on the MESSAGE DATA EDITOR screen Alarm number Faulty location/corrective action Contents INPUT INVALID Enter ";" in the 5th digit position in the The delimiter code - semicolon (;) - was batch message input process. not entered
- Page 726A.ALARM LIST APPENDIX B-63945EN/02 Error messages that may be displayed on the I/O MODULE EDITOR screen Alarm number Faulty location/corrective action Contents GROUP NUMBER IS TOO Specify 15 or a smaller value as the The entered group number is too large. LARGE group number. BASE NUMBER IS TOO LARGE
- Page 727B-63945EN/02 APPENDIX A.ALARM LIST Error messages that may be displayed on the SIGNAL STATUS screen Alarm number Faulty location/corrective action Contents INPUT INVALID Enter a numerical value correctly, as The entered numerical value or its input instructed in "Screen operations using format is in
- Page 728A.ALARM LIST APPENDIX B-63945EN/02 A.2.4 I/O Communication Error Messages The error messages that may appear on the I/O screen and their meanings and actions are listed below. Error messages displayed during memory card I/O operation Alarm number Faulty location/corrective action Contents MEMORY CAR
- Page 729B-63945EN/02 APPENDIX A.ALARM LIST Alarm number Faulty location/corrective action Contents MEMORY CARD IS USED BY Retry after terminating the other Some other function is currently using the OTHER FUNCTION function that is currently using the memory card. memory card. MEMORY CARD IS WRITE Cancel the
- Page 730A.ALARM LIST APPENDIX B-63945EN/02 Error messages displayed during FLOPPY or other input/output device I/O operation. Alarm number Faulty location/corrective action Contents ILLEGAL PMC PARAMETER Specify a file of the PMC parameter The specified file is not of the PMC FORMAT format. Also, check the
- Page 731B-63945EN/02 APPENDIX A.ALARM LIST Common error messages that may be displayed on individual devices during the I/O operations Alarm number Faulty location/corrective action Contents ERROR OCCURS IN LADDER Check the PMC alarm screen and Data cannot be output because there is an PROGRAM correct the i
- Page 732A.ALARM LIST APPENDIX B-63945EN/02 A.3 ALARM LIST (SERIAL SPINDLE) When a serial spindle alarm occurs, the following number is displayed on the CNC. NOTE * Note that the meanings of the SPM indications differ depending on which LED, the red or yellow LED, is on. When the red LED is on, the SPM indic
- Page 733B-63945EN/02 APPENDIX A.ALARM LIST Number Message SPM Faulty location and remedy Description indication (*1) SP9007 SSPA:07 OVER 07 Check for a sequence error. The motor speed has exceeded SPEED (For example, check whether 115% of its rated speed. When the spindle synchronization was spindle axis wa
- Page 734A.ALARM LIST APPENDIX B-63945EN/02 Number Message SPM Faulty location and remedy Description indication (*1) SP9021 POS SENSOR 21 Check and correct the The polarity parameter setting of the POLARITY ERROR parameters. position sensor is wrong. (No. 4000#0, 4001#4) SP9024 SSPA:24 SERIAL 24 1 Place the
- Page 735B-63945EN/02 APPENDIX A.ALARM LIST Number Message SPM Faulty location and remedy Description indication (*1) SP9036 SSPA:36 36 Check whether the position An error counter overflow occurred. OVERFLOW gain value is too large, and ERROR COUNTER correct the value. SP9037 SSPA:37 ILLEGAL 37 Correct the v
- Page 736A.ALARM LIST APPENDIX B-63945EN/02 Number Message SPM Faulty location and remedy Description indication (*1) SP9051 SSPA:51 LOW VOLT 51 1 Check and correct the power Input voltage drop was detected. (PSM POWER CIRCUIT supply voltage. alarm indication: 4) (Momentary power 2 Replace the MC. failure or
- Page 737B-63945EN/02 APPENDIX A.ALARM LIST Number Message SPM Faulty location and remedy Description indication (*1) SP9069 SAFETY SPEED 69 1 Check the specified speed. In the state in which safety speed OVER 2 Check parameter settings. monitoring was enabled, the system 3 Check the sequence. detected that
- Page 738A.ALARM LIST APPENDIX B-63945EN/02 Number Message SPM Faulty location and remedy Description indication (*1) SP9084 SPNDL SENSOR 84 1 Replace the feedback cable. The spindle sensor feedback signal DISCONNECTED 2 Check the shield processing. is not present. 3 Check and correct the connection. 4 Check
- Page 739B-63945EN/02 APPENDIX A.ALARM LIST Number Message SPM Faulty location and remedy Description indication (*1) SP9121 COMMUNICATION C1 1 Replace the communication Communication data alarm DATA ERROR cable between CNC and SPM. 2 Replace the SPM control printed circuit board. 3 Replace the CNC side spin
- Page 740A.ALARM LIST APPENDIX B-63945EN/02 A.4 ERROR CODES (SERIAL SPINDLE) NOTE *1 Note that the meanings of the SPM indications differ depending on which LED, the red or yellow LED, is on. When the yellow LED is on, an error code is indicated with a 2-digit number. An error code is indicated in the CNC di
- Page 741B-63945EN/02 APPENDIX A.ALARM LIST SPM indication Faulty location and remedy Description (*1) 10 A Cs contour control command is input, but another Do not switch to another mode during a Cs mode (servo mode, spindle synchronization, or contour control command. orientation) is specified. Before movin
- Page 742B.LIST OF MAINTENANCE PARTS APPENDIX B-63945EN/02 B Fuse and fan LIST OF MAINTENANCE PARTS Item Ordering Rem information arks Fuse LCD-mo For i series control unit (7.2”/8.4”/10.4”) A02B-0236-K100 unted For i series control unit (15” ) A02B-0236-K101 type For is series control unit Stand-al For cont
- Page 743B-63945EN/02 APPENDIX C.BOOT SYSTEM C BOOT SYSTEM C.1 OVERVIEW ............................................................................ 716 C.2 SCREEN CONFIGURATION AND OPERATING PROCEDURE.......................................................................... 719 C.3 ERROR MESSAGES AND REQUIR
- Page 744C.BOOT SYSTEM APPENDIX B-63945EN/02 C.1 OVERVIEW The boot system load the CNC system software (flash RAM → DRAM), then starts it so that software can be executed. The boot system provides the following maintenance functions for the CNC: (1) Registering a file in Flash ROM Reads a file from a Memory
- Page 745B-63945EN/02 APPENDIX C.BOOT SYSTEM C.1.1 Displaying the Power ON Sequence (1) RAM TEST :END (2) ROM TEST :END [60W1A] (3) DRAM ID :xxxxxxxx (4) SRAM ID :xxxxxxxx (5) FROM ID :xxxxxxxx *** MESSAGE *** (7) LOADING CNC DATA-1 xxxxxx/xxxxxx END RAM TEST :END (2) ROM TEST :ERROR Processing is stopped in
- Page 746C.BOOT SYSTEM APPENDIX B-63945EN/02 C.1.2 Starting the Boot System In ordinary system activation, the boot system automatically transfers files from Flash ROM to DRAM in the background. The user is not aware of this operation. However, the boot system must be operated manually, from menu screen, whe
- Page 747B-63945EN/02 APPENDIX C.BOOT SYSTEM C.2 SCREEN CONFIGURATION AND OPERATING PROCEDURE When the boot system is first started, the MAIN MENU screen is displayed. This screen is described below : MAIN MENU screen (1) SYSTEM MONITOR MAIN MENU 60W1 - 01 (1) Screen title. The series and edition of the BOOT
- Page 748C.BOOT SYSTEM APPENDIX B-63945EN/02 C.2.1 USER DATA LOADING/SYSTEM DATA LOADING Screen Description This screen is used to read a system or user file from a Memory card into Flash ROM. The USER DATA LOADING screen is used to load ROM data from a Memory card to flash memory. The SYSTEM DATA LOADING sc
- Page 749B-63945EN/02 APPENDIX C.BOOT SYSTEM (3) When you select a file from the SYSTEM DATA LOADING screen, a ROM data confirmation screen is displayed for confirmation. SYSTEM DATA CHECK & DATA LOADING G001A_B1.MEM 1 G001 001A 2 G001 021A 3 G001 041A 4 G001 061A 5 G001 081A 6 G001 0A1A 7 G001 0C1A 8 G001 0
- Page 750C.BOOT SYSTEM APPENDIX B-63945EN/02 C.2.2 SYSTEM DATA CHECK Screen Description This screen is used to list files in Flash ROM or Memory card, together with the corresponding numbers of management units in each file and the series and edition of the software. Screen configuration (1) SYSTEM DATA CHEC
- Page 751B-63945EN/02 APPENDIX C.BOOT SYSTEM Screen configuration (MEMORY CARD SYSTEM screen) (1) SYSTEM DATA CHECK (1) Screen title. (2) MEMORY CARD DIRECTORY (FREE[KB]: 5123) (2) The size of the free space of the (3) 1 G001A_B1.MEM 1048704 2003-01-01 12:00 Memory card is displayed. 2 G001A_B2.MEM 1048704 2
- Page 752C.BOOT SYSTEM APPENDIX B-63945EN/02 Others (Parity information for the system file and user file) The NC BAS-1, DGD0SRVO, and other system files in Flash ROM contain parity information in each management unit. If the file name field or parity field on the check screen contains a non-ASC II character
- Page 753B-63945EN/02 APPENDIX C.BOOT SYSTEM C.2.3 SYSTEM DATA DELETE Screen Description This screen is used to delete a user file from Flash ROM or Memory card. Screen configuration (1) SYSTEM DATA DELETE (1) Screen title. (2) 1.FROM SYSTEM (2) Select the FROM SYSTEM screen. (3) 2.MEMORY CARD SYSTEM (3) Sel
- Page 754C.BOOT SYSTEM APPENDIX B-63945EN/02 Screen configuration (MEMORY CARD SYSTEM screen) (1) SYSTEM DATA DELETE (1) Screen title. (2) MEMORY CARD DIRECTORY (FREE[KB]: 5123) (2) The size of the free space of the (3) 1 G001A_B1.MEM 1048704 2003-01-01 12:00 Memory card is displayed. 2 G001A_B2.MEM 1048704
- Page 755B-63945EN/02 APPENDIX C.BOOT SYSTEM C.2.4 SYSTEM DATA SAVE Screen Description This screen is used to write a user file in Flash ROM to a Memory card. Only user files can be saved from Flash ROM to a Memory card. System files cannot be saved. Screen configuration (1) SYSTEM DATA SAVE (1) Screen title
- Page 756C.BOOT SYSTEM APPENDIX B-63945EN/02 (4) When saving terminates normally, the system displays the following message. Press the [SELECT] key. The names of files written to the Memory card are listed. Check the file names by, for example, making a note of the list. *** MESSAGE *** FILE SAVE COMPLETE. H
- Page 757B-63945EN/02 APPENDIX C.BOOT SYSTEM C.2.5 SRAM DATA BACKUP Screen Description This screen is used to collectively save and restore parameters, tool compensation memories, and other data, retained after the CNC power in SRAM is turned off, to and from a Memory card. Screen configuration (1) SRAM DATA
- Page 758C.BOOT SYSTEM APPENDIX B-63945EN/02 (4) Upon the termination of backup, a message such as that shown below is displayed. Click the [SELECT] key to terminate the operation. *** MESSAGE *** SRAM BACKUP COMPLETE. HIT SELECT KEY. [SELECT][ YES ][ NO ][ UP ][ DOWN ] Operating procedure (Restoring the dat
- Page 759B-63945EN/02 APPENDIX C.BOOT SYSTEM CAUTION 1 Backup files will be created with a file name of SRAMBAK.xxx, where xxx is replaced with a number between 001 and 999 sequentially. On the first Memory card, a backup file is created with a name of SRAMBAK.001. If all data is not contained on the single
- Page 760C.BOOT SYSTEM APPENDIX B-63945EN/02 C.2.6 MEMORY CARD FORMAT Screen Description This function is used to format a Memory card. Memory cards must be formatted before they can be used for the first time or before they can be re-used after their data has been destroyed or lost because of, for example,
- Page 761B-63945EN/02 APPENDIX C.BOOT SYSTEM C.2.7 LOAD BASIC SYSTEM Description The function is used to terminate the boot system and activate the CNC. Operating procedure From the MAIN MENU screen, select "1. END." The system displays the "ARE YOU SURE? HIT YES OR NO" message. To terminate the boot system
- Page 762C.BOOT SYSTEM APPENDIX B-63945EN/02 C.2.8 Cautions CAUTION Bear the following cautions in mind if using boot software of the 60W1/06 edition or later: When restoring the following data in this system, be sure to restore a pair of SRAM data and ATA PROG data which were backed up at the same time. (AT
- Page 763B-63945EN/02 APPENDIX C.BOOT SYSTEM C.3 ERROR MESSAGES AND REQUIRED ACTIONS The following table lists and explains error messages in alphabetical order. Message Description and required action D DEVICE ERROR (xxxx) An attempt to write data to Flash ROM was unsuccessful. Turn the power off and back o
- Page 764C.BOOT SYSTEM APPENDIX B-63945EN/02 Message Description and required action M MEMORY CARD FULL. The Memory card is full. Delete any unnecessary files from HIT SELECT KEY. the Memory card. Alternatively, replace the Memory card with another card having sufficient free space. MEMORY CARD MOUNT ERROR.
- Page 765B-63945EN/02 D.MEMRY CARD SLOT D MEMRY CARD SLOT D.1 OVERVIEW.............................................................................738 D.2 MEMORY CARD TYPES (FUNCTIONS) .............................739 D.3 HARDWARE CONFIGURATION .........................................741 - 737 -
- Page 766D.MEMRY CARD SLOT B-63945EN/02 D.1 OVERVIEW Whether a memory card slot is provided or not depends on the hardware configuration. See the following table: Hardware Card slot on LCD unit Card slot on control unit configuration Type 1 Provided No card slot Provided Type 2 Provided (This slot, however,
- Page 767B-63945EN/02 D.MEMRY CARD SLOT D.2 MEMORY CARD TYPES (FUNCTIONS) Flash ATA card (Data I/O) Compact flash card (Data I/O) Modem card (for remote diagnosis) NOTE For details of the types of usable memory cards, see the CONNECTION MANUAL (HARDWARE) (B-63943EN). Using the compact flash card adapter 1. I
- Page 768D.MEMRY CARD SLOT B-63945EN/02 Lock lever A Compact flash card Eject button B Compact flash card adapter - 740 -
- Page 769B-63945EN/02 D.MEMRY CARD SLOT D.3 HARDWARE CONFIGURATION • Type 1 LCD-mounted type LCD MDI Card slot on LCD unit Control unit (LCD-mounted type) • Type 2 Stand-alone type (with an LCD unit) Optical cable Card slot on control LCD MDI unit LCD link card Card slot on LCD LCD unit for unit stand-alone
- Page 770E.LED DISPLAY B-63945EN/02 E LED DISPLAY E.1 OVERIVIEW............................................................................743 E.2 7-SEGMENT LED INDICATIONS (TURNED ON) ..............744 E.3 7-SEGMENT LED INDICATIONS (BLINKING)..................747 - 742 -
- Page 771B-63945EN/02 E.LED DISPLAY E.1 OVERIVIEW On the CNC, a 7-segment LED is installed. The 7-segment LED indication changes according to the operating status of the CNC. The 7-segment LED indications provided after the power is turned on until the CNC is ready for operation and when system errors occur
- Page 772E.LED DISPLAY B-63945EN/02 E.2 7-SEGMENT LED INDICATIONS (TURNED ON) 表 E.1 Meanings of LED Indications LED Display Meaning Power not turned on (power-off state) Initialization completed and ready for operation CPU started up (BOOT system) Initialization of G/A (BOOT system) Initialization of various
- Page 773B-63945EN/02 E.LED DISPLAY LED Display Meaning Loading of basic system software (BOOT system) Optional board waiting 3 Optional board waiting 4 Final system operation check Indicator initialization (BOOT system) FROM initialization (BOOT system) OPEN CNC BOOT (NCBOOT32) being executed BOOT monitorin
- Page 774E.LED DISPLAY B-63945EN/02 NOTE Refer to Section 2.4 for LCD-mounted type 30i/31i/32i. Refer to Section 3.4 for LCD-mounted type 300is/310is/320is. Refer to Section 4.4 for stand-alone. (The name is alarm LED "4".) - 746 -
- Page 775B-63945EN/02 E.LED DISPLAY E.3 7-SEGMENT LED INDICATIONS (BLINKING) LED Meaning Display Action ROM PARITY error The SRAM/FROM module may be faulty. An FROM file for program memory cannot be created. The state of the file for program memory on the FROM is checked with the BOOT system. Rearrange the F
- Page 776F.MAINTENANCE OF OPEN CNC (BOOT-UP AND IPL) APPENDIX B-63945EN/02 F MAINTENANCE OF OPEN CNC (BOOT-UP AND IPL) F.1 OVERVIEW.............................................................................749 F.2 CHANGING START SEQUENCES .......................................751 F.3 EXPLANATION OF SCREEN
- Page 777B-63945EN/02 APPENDIX F.MAINTENANCE OF OPEN CNC (BOOT-UP AND IPL) F.1 OVERVIEW When the Series 300i/310i/320i/300is/310is/320is is used or the CNC is connected to the PC over HSSB, Ncboot32.exe can be used for the maintenance of the CNC. NOTE When the CNC is connected to the PC over Ethernet, use th
- Page 778F.MAINTENANCE OF OPEN CNC (BOOT-UP AND IPL) APPENDIX B-63945EN/02 System tray (Series 300i/310i/320i) Right-click the icon in the system tray, and the popup menu, shown below, appears at the lower left corner of the screen. Selecting [Open] causes the status screen to open. Selecting [About] causes
- Page 779B-63945EN/02 APPENDIX F.MAINTENANCE OF OPEN CNC (BOOT-UP AND IPL) F.2 CHANGING START SEQUENCES By pressing the MDI keys 6 and 7 and turning the power ON or by setting the rotary switch provided on the main board of the CNC main unit (for the LCD-mounted type Series 300is) to the F position, you can
- Page 780F.MAINTENANCE OF OPEN CNC (BOOT-UP AND IPL) APPENDIX B-63945EN/02 F.3 EXPLANATION OF SCREENS NOTE To open each screen of Ncboot32.exe, you are recommended to use either the mouse or touch panel. F.3.1 BOOT Screen The area where the file is to be placed can be changed by using the [Setting...] button
- Page 781B-63945EN/02 APPENDIX F.MAINTENANCE OF OPEN CNC (BOOT-UP AND IPL) F.3.1.1 System data manipulation The following screen is used for manipulating system data (including control software and ladder programs) on the NC. [Load...] opens the file selection screen. Specify a file to be loaded. [Save] save
- Page 782F.MAINTENANCE OF OPEN CNC (BOOT-UP AND IPL) APPENDIX B-63945EN/02 F.3.1.2 SRAM operation This screen is used to store and restore NC SRAM data. [Backup] stores SRAM data, and [Restore] restores SRAM data. In the center of the screen, the progress status is displayed. As with the NC, the backup file
- Page 783B-63945EN/02 APPENDIX F.MAINTENANCE OF OPEN CNC (BOOT-UP AND IPL) F.3.1.3 File operation The following screen is used for operating files on a memory card in the CNC or in a folder of the PC. [Delete] deletes a selected file. [Format] formats the memory card. This button is valid when the memory car
- Page 784F.MAINTENANCE OF OPEN CNC (BOOT-UP AND IPL) APPENDIX B-63945EN/02 F.3.2 IPL Screen NOTE The contents of the IPL screen vary depending on the CNC model. Follow the instructions displayed in the menu. The CNC allows functions to be performed according to the key status set at power-on. The open CNC do
- Page 785B-63945EN/02 APPENDIX F.MAINTENANCE OF OPEN CNC (BOOT-UP AND IPL) F.3.2.1 Functions on the IPL screen Corresponding MDI key operation Title on IPL screen at power-on (Operation with a standard CNC) 0. EXIT 1. IPL MONITOR <-> + <.> 2. BACK-UP CNC DATA ALL CLEAR
+ 3. LOCKED PROGRAM AL - Page 786F.MAINTENANCE OF OPEN CNC (BOOT-UP AND IPL) APPENDIX B-63945EN/02 F.4 OTHER SCREENS F.4.1 CNC Alarm Screen This screen appears when a system alarm is issued in the CNC. (The above screen is an example. The displayed information varies depending on the system alarm issued in the CNC.) - 758 -
- Page 787B-63945EN/02 APPENDIX F.MAINTENANCE OF OPEN CNC (BOOT-UP AND IPL) F.4.2 Status Screen (Series 300i/310i/320i only) To open the status screen, double-click the icon in the system tray. Alternatively, in the menu popped up by right-clicking, click OPEN. Node: Node number Name: Node name. (Define the n
- Page 788F.MAINTENANCE OF OPEN CNC (BOOT-UP AND IPL) APPENDIX B-63945EN/02 F.4.3 Option Setting Screen On the option setting screen, application programs can be registered. Any programs for use with FOCAS2 will not run unless they are started after FOCAS2 starts. By registering these programs in Ncboot32.exe
- Page 789B-63945EN/02 APPENDIX F.MAINTENANCE OF OPEN CNC (BOOT-UP AND IPL) F.4.3.2 Option setting screen (Series 300is/310is/320is) To open the option setting screen, double-tap the icon in the system tray. Alternatively, select [Open] from the popup menu of the system tray. NOTE For any changes made on the
- Page 790F.MAINTENANCE OF OPEN CNC (BOOT-UP AND IPL) APPENDIX B-63945EN/02 [MDI]-[Definition file] allows you to specify a customized MDI key definition file. Device setting screen Place a check mark next to [Allow CNC to use Windows devices] to make the devices on Windows (Ethernet, serial, and PCMCIA devic
- Page 791B-63945EN/02 APPENDIX F.MAINTENANCE OF OPEN CNC (BOOT-UP AND IPL) NOTE Usually, the contents of the Registry are not changed and, therefore, no problems will arise if they are not automatically saved. You are recommended to remove the check mark next to Auto saving of Registry just in case. [Battery
- Page 792F.MAINTENANCE OF OPEN CNC (BOOT-UP AND IPL) APPENDIX B-63945EN/02 - Start screen In the [File name] field, specify a full path name of the file to be executed. In the [Parameter] field, specify the program argument. - Load/Save screen [Type] is used to specify whether the file is on the Disk (object
- Page 793B-63945EN/02 APPENDIX G.MEMORY CLEAR G MEMORY CLEAR G.1 OVERVIEW.............................................................................766 G.2 OPERATION METHOD..........................................................766 G.3 DATA TYPES TO BE CLEARED ..........................................76
- Page 794G.MEMORY CLEAR APPENDIX B-63945EN/02 G.1 OVERVIEW If an unexpected error occurs, such as the "SYSTEM LABEL CHECK ERROR" at system startup or the "SYSTEM ALARM", which may be generated suddenly, this function can start up the CNC system in its initial state to return the system to the state in which
- Page 795B-63945EN/02 APPENDIX G.MEMORY CLEAR 2. Memory all clear approval screen Performing the operation in 1. causes the following screen to be displayed, asking you whether to execute all clear. Memory All Clear Approval Screen From the screen shown above, select between the following operation and execu
- Page 796G.MEMORY CLEAR APPENDIX B-63945EN/02 G.3 DATA TYPES TO BE CLEARED The various data types to be cleared by this operation are as follows: Data type Data area System label SRAM Option parameters SRAM Data related to C language executor SRAM (such as SRAM disk data) Data related to macro executor (such
- Page 797B-63945EN/02 APPENDIX G.MEMORY CLEAR Data type Data area FSSB data SRAM MNUAL GUIDE i data SRAM Dual check safety data SRAM Data related to C language board function SRAM CAUTION The types of data stored in SRAM/FROM differ depending on the system configuration. - 769 -
- Page 798H.PANEL i BIOS SETUP APPENDIX B-63945EN/02 H PANEL i BIOS SETUP What is "BIOS setup"? BIOS setup is the program to specify BIOS settings. Based on the settings, the operating environment is defined. Before shipment from the factory, Default values are set and, usually, these settings need not be cha
- Page 799B-63945EN/02 APPENDIX H.PANEL i BIOS SETUP Starting setup 1. Terminate your work and save data. 2. Turn the power OFF, connect an input device such as a full keyboard, and start up the system again. 3. While "Press
to enter SETUP" appears at the bottom of the screen, press the "F2" key, then BI - Page 800H.PANEL i BIOS SETUP APPENDIX B-63945EN/02 Message with a triangle in the Solution required column This message may be displayed if battery supply is stopped, for example. If it is displayed several times, some action is required. Error Solution BIOS message Meaning code required ○ CPU Temperature E
- Page 801B-63945EN/02 INDEX INDEX ATTACHING AND DETACHING LCD/MDI UNITS 349
AUTOMATIC OPERATION CANNOT BE DONE ....580 7-SEGMENT LED INDICATIONS (BLINKING)....... 747 Automatic Setting of Standard Parameters....................555 7-SEGMENT LED INDICATIONS (TURNED ON) ... 744 Automatic start of trac - Page 802INDEX B-63945EN/02 Demounting a DIMM Module ...................................... 311
Detaching ...................................................................... 349 General Screen Operations................................................3 DeviceNet Master Board........................... - Page 803B-63945EN/02 INDEX
Method B of gear change for M series JOG OPERATION CANNOT BE DONE .................... 571 (Parameter No. 3705#2=1) ............................................545 Method of Extraction .................................... 304, 307, 313 Method of Insertion.................. - Page 804INDEX B-63945EN/02 Outputting Part Program ............................................... 357 REPLACING THE FAN MOTOR................................211 Outputting Pitch Error Compensation Amount ............. 356 Replacing the Fuse ................................................ 268, 280 Outputti
- Page 805B-63945EN/02 INDEX SPC ALARMS .............................................................. 614 SPINDLE ALARMS..................................................... 615 USER DATA LOADING/SYSTEM DATA LOADING Spindle Information Screen........................................... 559 Screen.........
- Page 806
- Page 807Revision Record FANUC Series 30i/300i/300is-MODEL A, Series 31i/310i/310is-MODEL A5, Series 31i/310i/310is-MODEL A, Series 32i/320i/320is-MODEL A MAINTENANCE MANUAL (B-63945EN) Addition of functions Addition of following models 02 Jun, 2004 - Series 31i /310i /310is-MODEL A5 - Series 31i /310i /310i
- Page 808
- Page 809FANUC Series 30i/300i/300is-MODEL A FANUC Series 31i/310i/310is-MODEL A5 FANUC Series 31i/310i/310is-MODEL A FANUC Series 32i/320i/320is-MODEL A The correction of MAINTENANCE MANUAL 1. Type of applied technical documents FANUC Series 30i/300i/300is-MODEL A Name FANUC Series 31i/310i/310is-MODEL A5 F
- Page 810The following alarm numbers, messages, and content are added to the item of Appendix A.1 ALARM LIST (CNC). Page No.661 2032 BOARD ERROR (DATA SERVER) An error was returned from the board in the Ethernet/data server board function. Page No.668 5462 ILLEGAL COMMAND (G68.2/G69) (1)The modal is in error
- Page 811SV484 SAFTY FUNCTION ERROR (SV) An error occurred in safety functions of Servo: 1. The Servo or CNC detected the inexecution of servo software safety functions. 2. A mismatch between the servo software results of the safety functions and the CNC results of them occurred. 3. An error occurred in a se
- Page 812Page No.676 PW0008 CPU SELF TEST ERROR(DCS PMC) The DCS PMC detected the error in the CPU self test function and RAM check function. PW0009 CPU SELF TEST ERROR(PMC) The PMC detected the error in the CPU self test function and RAM check function. PW0010 SAFE I/O CROSS CHECK ERROR(DCS The DCS PMC dete
- Page 813DS0012 ILLEGAL REFERENCE AREA The malfunction prevention function detected an illegal reference area. DS0013 ILLEGAL REFERENCE AREA The malfunction prevention function detected an illegal reference area. Page No.680 DS0016 SERIAL DCL:FOLLOW-UP ERROR 1. The value of parameter No.1883,No.1884 is out o
- Page 814FANUC Series 30i/31i-A, 31i-A5 Grinding Wheel Wear Compensation 1.Type of applied technical documents FANUC Series 30i/300i/300is –MODEL A FANUC Series 31i/310i/310is –MODEL A FANUC Series 31i/310i/310is –MODEL A5 Name MAINTENANCE MANUAL B-63945EN/02 Spec. No./Version 2.Summary of Change New, Add Ap
- Page 815Add the following description in the chapter “A.1 ALARM LIST(CNC)” Number Message Description The P data in selection of the grinding-wheel wear ILLEGAL P-DATA (WHEEL WEAR PS1618 compensation center is illegal, or the P command is not COMPENSATION) specified. During grinding-wheel wear compensation
- Page 816FANUC Series 30i/300i/300is-MODEL A FANUC Series 31i/310i/310is-MODEL A5 FANUC Series 31i/310i/310is-MODEL A FANUC Series 32i/320i/320is-MODEL A The correction of MAINTENANCE MANUAL 1. Type of applied technical documents FANUC Series 30i/300i/300is-MODEL A Name FANUC Series 31i/310i/310is-MODEL A5 F
- Page 817Please replace the section “8.1 EMBEDDED ETHERNET PORT AND PCMCIA ETHERNET CARD ” (Page 474) of the MAINTENCE MANUAL (B-63945EN/02) with following description. FANUC Series 30i/300i/300is-MODEL A Title FANUC Series 31i/310i/310is-MODEL A5 FANUC Series 31i/310i/310is-MODEL A FANUC Series 32i/320i/320
- Page 8188.1 EMBEDDED ETHERNET PORT AND PCMCIA ETHERNET CARD The embedded Ethernet function can be used by selecting one of two connection locations: the embedded Ethernet port and PCMCIA Ethernet card. And the embedded Ethernet function can be stopped by a parameter. The PCMCIA Ethernet card is to be insert
- Page 819Related NC parameters #7 #6 #5 #4 #3 #2 #1 #0 14880 ETH [Data type] Bit ETH The embedded Ethernet function is: 1: Not used. 0: Used. NOTE This parameter is available on 656F/06 or later. 14896 Select the connection location for the embedded Ethernet function [Data type] Byte [Valid data range] In th
- Page 820Notice when using Windows CE’s Ethernet of FS300is/310is/320is In the FS300is/310is/320is, the embedded Ethernet function of CNC and an application software of Windows CE can use the Ethernet interface on Windows CE at the same time. Therefore, please be careful because there are the following limit
- Page 821TECHNICAL REPORT (MANUAL) NO.TMN 05/ E Date 2005.10.7 General Manager of Software Research Laboratory FANUC Series 30i /31i /32i -MODEL A Appliance of 9 digits of the reference counter on the servo setting screen (Ver.02) 1.Communicate this report to: ○ Your information only ○ GE Fanuc-N, GE Fanuc-E
- Page 822FANUC Series 30i /31i /32i -MODEL A Appliance of 9 digits of the reference counter on the servo setting screen (Ver.02) 1. Type of applied technical documents Name FANUC Series 30i /300i /300i s-MODEL A FANUC Series 31i /310i /310i s-MODEL A5 FANUC Series 31i /310i /310i s-MODEL A FANUC Series 32i /
- Page 823The setting and display of the reference counter was applied to 9 digits by decreasing the number of axes to 2 from 3 and increasing the number of digits an axis on the servo setting screen. And the tables of motor model have been updated. So replace the description of the section 9.1 “Initial Setti
- Page 8249.1 INITIAL SETTING SERVO PARAMETERS This section describes how to set initial servo parameters, which is used for field adjustment of machine tool. 1. Turn on power at the emergency stop condition. 2. Set the parameter to display the servo tuning screen. #7 #6 #5 #4 #3 #2 #1 #0 3111 SVS #0 (SVS) 0:
- Page 825(1) Initial set bit #7 #6 #5 #4 #3 #2 #1 #0 2000 PRMCAL DGPRM PLC01 #3 (PRMCAL) 1: Turns to 1 when the initial setting is done. Note) No.2000#3 is not set and has no meaning in 30i/31i/32i. Ed.02 #1 (DGPRM) 0: Initial setting of digital servo parameter is done. 1: Initial setting of digital servo pa
- Page 826Table 9.1 (b) αiF series servo motor Motor Motor model Motor type No. 90D0 90E0 specification αiF1/5000 0202 252 A A αiF 2/5000 0205 255 A A αiF4/4000 0223 273 A A αiF8/3000 0227 277 A A αiF12/3000 0243 293 A A αiF22/3000 0247 297 A A αiF30/3000 0253 303 A A αiF40/3000 0257 307 A A Ed.02 αiF40/3000
- Page 827Table 9.1 (d) αiF (HV) series servo motor Motor Motor model Motor type No. 90D0 90E0 specification αiF 4/4000HV 0225 275 A A αiF 8/3000HV 0229 279 A A αiF 12/3000HV 0245 295 A A αiF 22/3000HV 0249 299 A A Loading is possible with the servo software of the series and edition listed above or subsequen
- Page 828Table 9.1 (g) LiS series Linear motor (Input 200V) Motor Motor model Motor type No. 90D0 90E0 specification LiS 300A1/4 0441-B200 351 G G LiS 600A1/4 0442-B200 353 G G LiS 900A1/4 0443-B200 355 G G LiS 1500B1/4 0444-B210 357 G G LiS 3000B2/2 0445-B110 360 G G LiS 3000B2/4 0445-B210 362 G G LiS 4500B
- Page 829Loading is possible with the servo software of the series and edition listed above or subsequent editions. (3) Arbitrary AMR function #7 #6 #5 #4 #3 #2 #1 #0 2001 AMR7 AMR6 AMR5 AMR4 AMR3 AMR2 AMR1 AMR0 (Axis) * Set "00000000". (4) CMR 1820 Command multiply ratio 1) When CMR is 1/2 to 1/27 Set value
- Page 830(6) N/M of feed gear (F⋅FG) 2084 n for flexible feed gear 2085 m for flexible feed gear Setting for the α Pulsecoder in the semi-closed mode Necessary position F⋅FG numerator (≤ 32767) feedback pulses per motor revolution (as irreducible = fraction) F⋅FG denominator (≤ 32767) 1,000,000 (Note 2) (Not
- Page 831Setting for use of a separate detector (full-closed) Number of position pulses corresponding to a F⋅FG numerator (≤ 32767) predetermined amount of travel (as F⋅FG denominator (≤ 32767) = Number of position pulses irreducible corresponding to a fraction) predetermined amount of travel from a separate
- Page 832NOTE 1 Setting of the number of position pulses for the semi-closed loop (indicated by (*1) in the above table) Set 12500. 2 As the number of position pulses, set the number of pulses fed back from a separate detector when the motor makes one revolution. (The flexible feed gear has no relevance to t
- Page 833With a position feedback pulse conversion coefficient, the number of position pulses is set using the product of two parameters. 2024 The number of position pulses 2185 Conversion coefficient for the number of position feedback pulses (Example of setting) When a linear scale with a minimum resolutio
- Page 834Example of setting) αi Pulsecoder, semi-closed loop (1 µm detection) Required number of Lead of ball screw Reference Grid width position pulses (mm/revolution) counter (mm) (pulses/revolution) 10 10000 10000 10 20 20000 20000 20 30 30000 30000 30 If there is an error between the required number of p
- Page 835(ii) Method of changing the detection unit Required number of position pulses per motor revolution = 20000/17 The values of all of the following parameters are multiplied by 17 to change the detection unit to 1/17 µm: Parameter to be changed Series 30i FFG Servo screen CMR Servo screen Reference cou
- Page 836Example of setting) Example 1) When Z phase interval = 50 mm and detection unit = 1 µm Reference counter = 50,000/1 = 50,000 Example 2) When detection unit = 0.001° with a rotation axis Reference counter = 360/0.001 = 360,000 Example 3) When there is only one Z phase as in the case of a linear scale
- Page 837TECHNICAL REPORT (MANUAL) NO.TMN 05/093E Date 2005.9.13 General Manager of Software Research Laboratory FANUC Series 30i /31i /32i -MODEL A The adjustment of the brightness of the Monochrome LCD 1.Communicate this report to: ○ Your information only ○ GE Fanuc-N, GE Fanuc-E FANUC Robotics CINCINNATI
- Page 838FANUC Series 30i /31i /32i -MODEL A The adjustment of the brightness of the Monochrome LCD 1. Type of applied technical documents Name FANUC Series 30i /300i /300i s-MODEL A FANUC Series 31i /310i /310i s-MODEL A5 FANUC Series 31i /310i /310i s-MODEL A FANUC Series 32i /320i /320i s-MODEL A MAINTENA
- Page 839Please add the following description as section 1.8 “The adjustment of the brightness of the Monochrome LCD” after the section 1.7 “Color Setting Screen” FANUC Series30i /31i /32i -MODEL A Title The adjustment of the brightness of the Monochrome LCD Draw No. B-63945EN/02-05 FD Data Design Descriptio
- Page 8401.8 THE ADJUSTMENT OF THE BRIGHTNESS OF THE MONOCHROME LCD The adjustment of the brightness of the Monochrome LCD can be executed. Procedure The adjustment of the brightness can be executed on the setting screen (handy). 1. Press the function key [OFFSET/SETTING]. 2. Press the soft key [SETTING] to